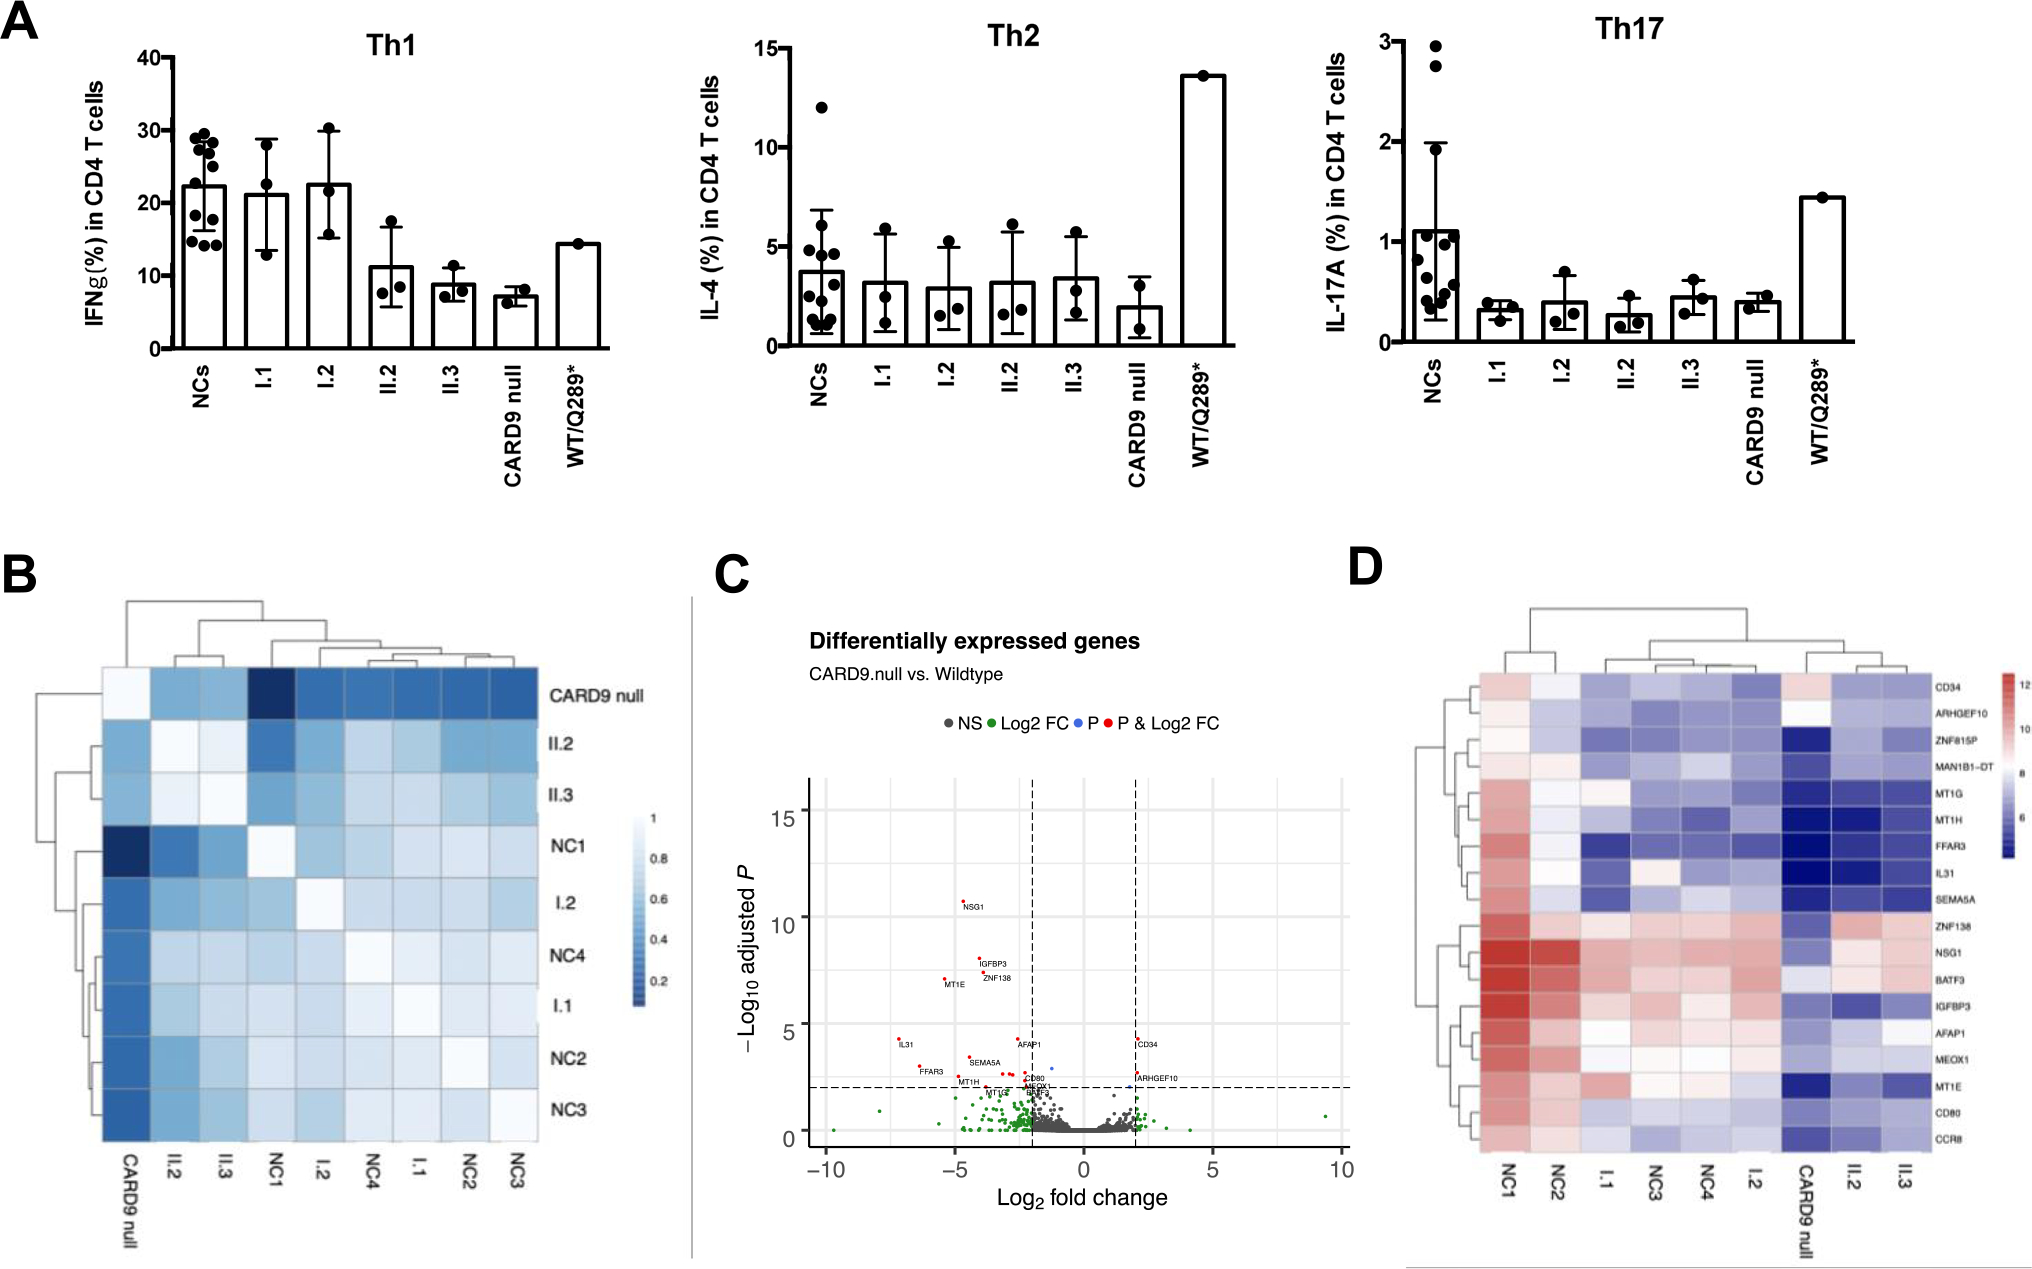
Fig. 4.

The effect of CARD9 on T cells. A Percentages of Th1, Th2, and Th17 cells from CD4+ T cells upon PMA/Ionomycin stimulation. Data are presented as mean ± SD from 12 healthy normal controls (NCs). Each dot in the research subjects indicates values from replicates. B–D RNAseq analyses of HKC-stimulated T cells from normal controls (NC) and indicated CARD9-mutated individuals. B Pearson correlation heatmap, C volcano plot, and D heatmap of the variance stabilized counts for all differentially expressed genes
