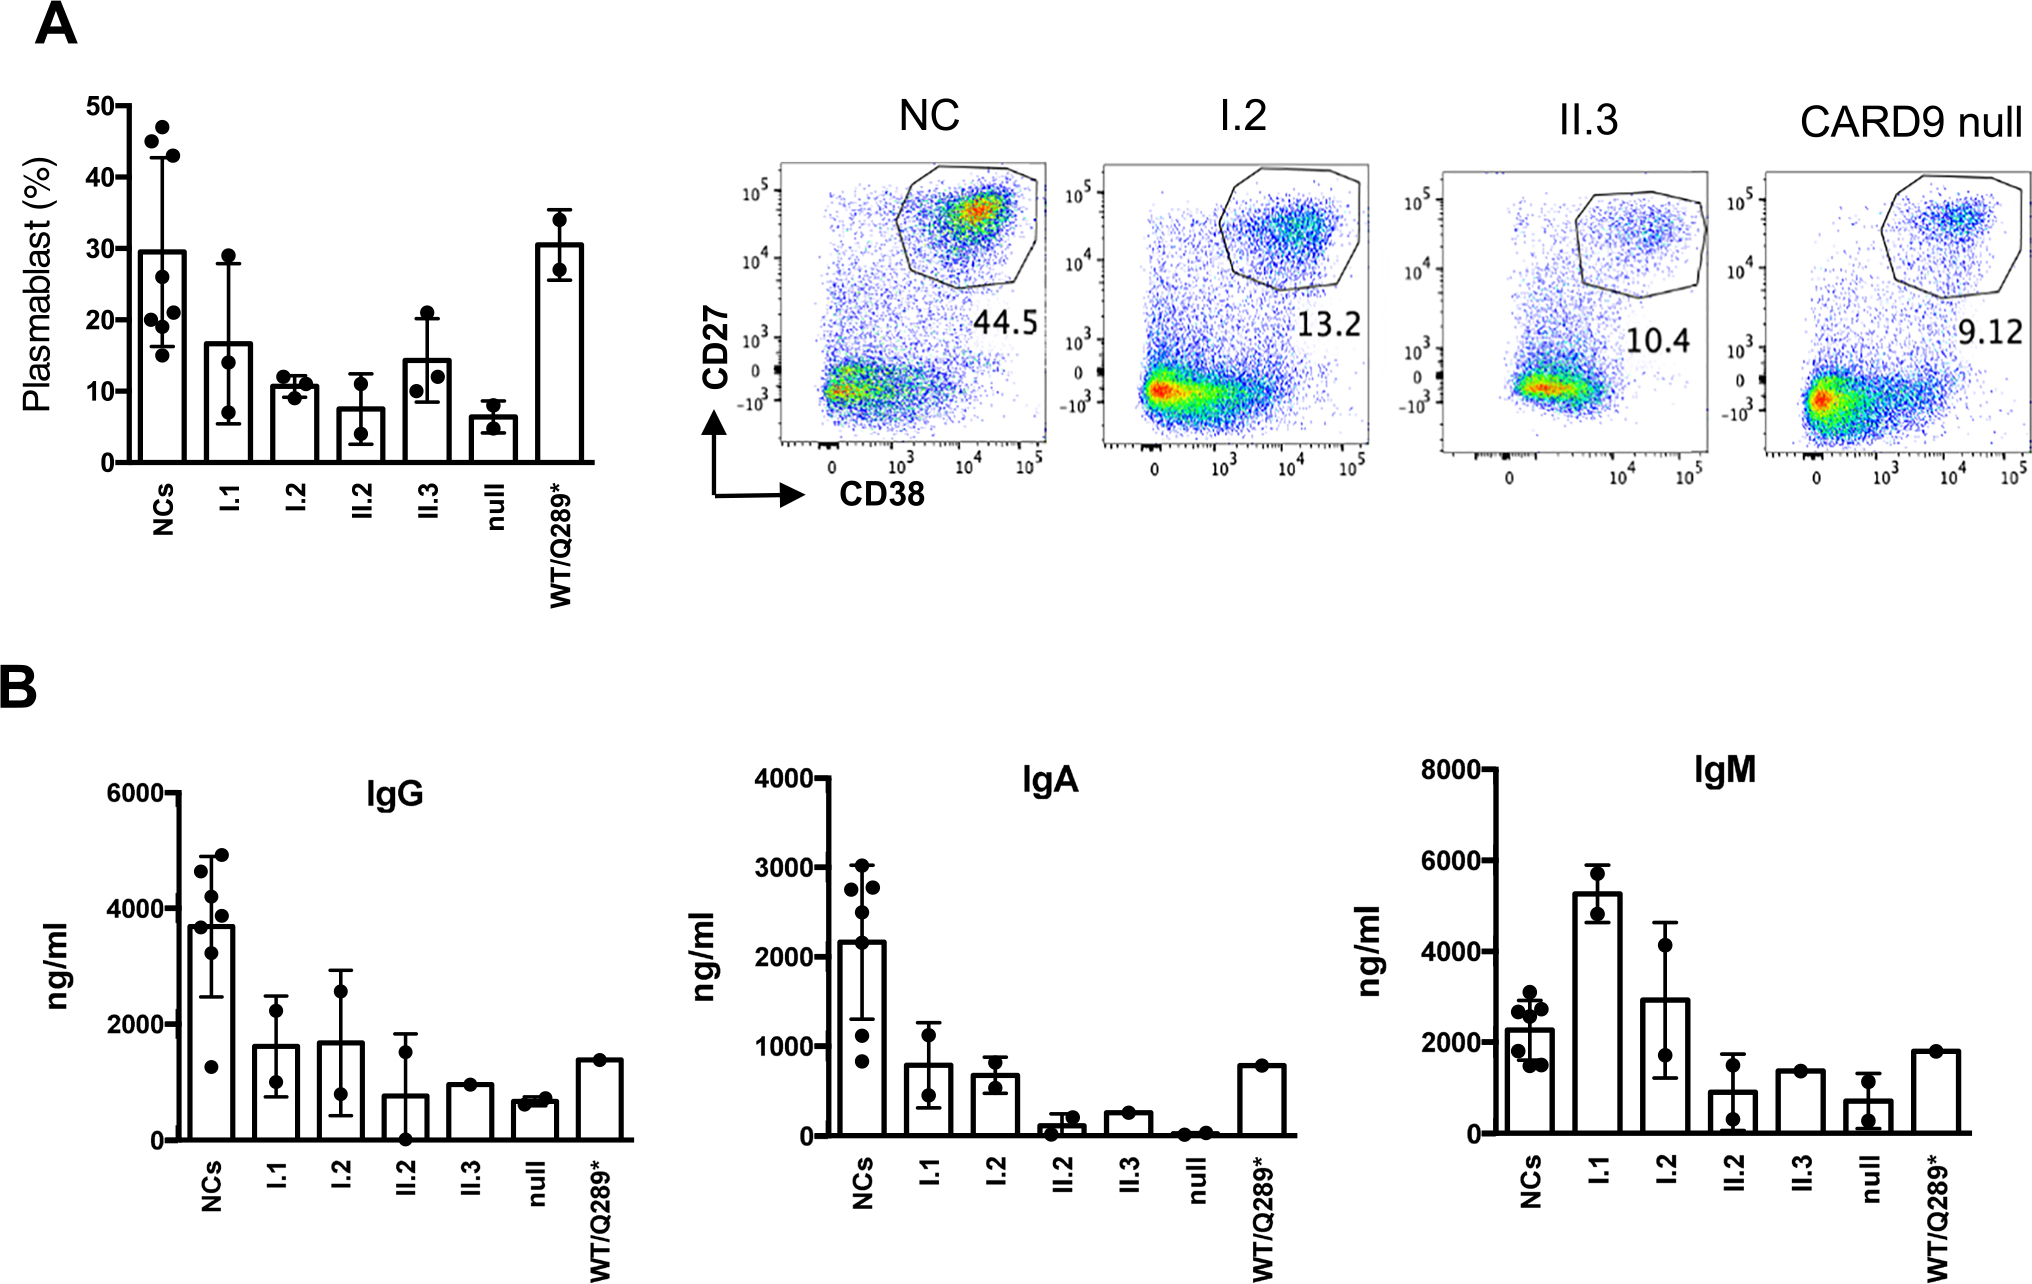
Fig. 5.

The effect of CARD9 on B cells. A PBMCs were stimulated with CD40L (100 ng/ml) together with IL-21(100 ng/ml) for 5 days, followed by cell surface staining with antibodies as indicated. A scatter plot of percentages of plasmablasts (% of CD27+CD38+ population from CD19+ B cells) and representative flowcytometric dot plots are shown. The values are expressed as the mean ± SD. B The culture supernatant was saved from the simulated samples from (A) and used for the immunoglobulin production assay. Scatter plot to show IgG, IgA, and IgM immunoglobulin (ng/ml) production, respectively. Data represent mean ± SD from 7 different healthy normal controls (NCs). Each dot in the research subjects indicates values from replicates
