Figure 2.

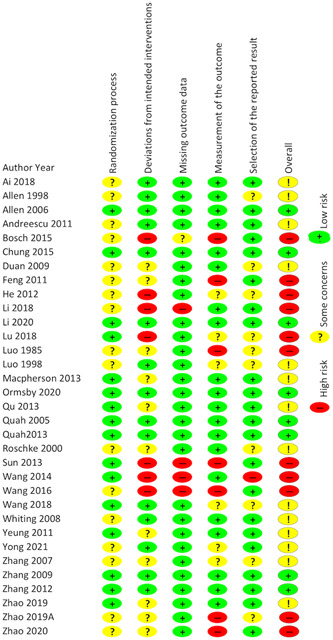
Quality assessment results included randomized controlled trials (a) risk of bias graph and (b) risk of bias summary. Green+, low risk; yellow?, some concerns; red−, high risk. [Color figure can be viewed at wileyonlinelibrary.com]

Quality assessment results included randomized controlled trials (a) risk of bias graph and (b) risk of bias summary. Green+, low risk; yellow?, some concerns; red−, high risk. [Color figure can be viewed at wileyonlinelibrary.com]