
Figure 2.
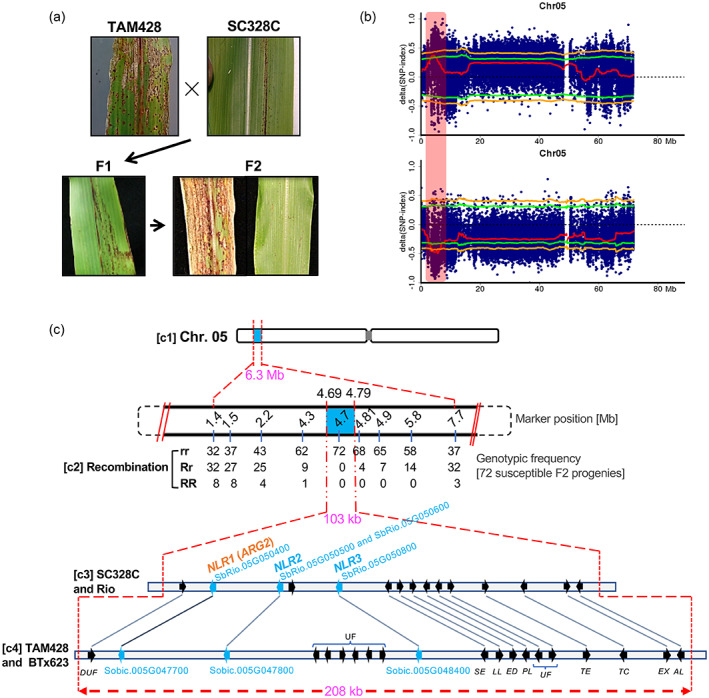
A diagrammatic summary of ARG2 genetic mapping.
(a) Disease symptom and resistance response on parents, F1 progenies and F2 progenies of the ARG2 mapping population.
(b) BSA‐Seq result showing ARG2 locus with respect to the resistant (upper) and the susceptible (lower) parental lines. The x‐axis is genomic coordinate and the y‐axis is ∆SNP‐index estimate. Each blue dot (highly overlapped) represents ∆SNP‐index estimate in the 2‐Mb sliding window and the red line is the ∆SNP‐index threshold. The green line shows a significance threshold (P = 0.05) of the ∆SNP‐index, with the orange line at P = 0.01. The vertical rectangular bar (light‐red shaded) marks the significant ARG2 mapping region.
(c) ARG2 fine mapping. (c1) ARG2 mapping region (6.3 Mb) as identified using BSA‐Seq. (c2) Genetic linkage analysis. The row of numbers (upper panel) are positions of indel markers that were used to generate the genotypic frequencies (c2, lower panel). (c3) The 103‐kb ARG2 mapping interval defined by the recombination analysis that carries 15 putative genes in the Rio reference genome. (c4) The corresponding genomic interval in the BTx623 reference genome (208 Mb) carries 20 putative genes. The short arrows in these two ARG2 genomic intervals show the relative position and orientation of the genes with the homologs linked using lines. The gene annotations are DUF, domain of unknown function; UF, unknown function; NLR, NBS‐LRR; SE, serine esterase; LL, limkain B Lkap; ED, Nad dependent epimerase/dehydratase; PL, TRNA‐nucleotidyl transferase/poly A polymerase family member; TE, TRANSCRIPTION ELONGATION FACTOR B POLYPEPTIDE 3; TC, CCR4‐NOT transcription complex subunit; EX, exocyst subunit EXO70 family protein C1‐related. ARG2 is NLR1 as identified later.