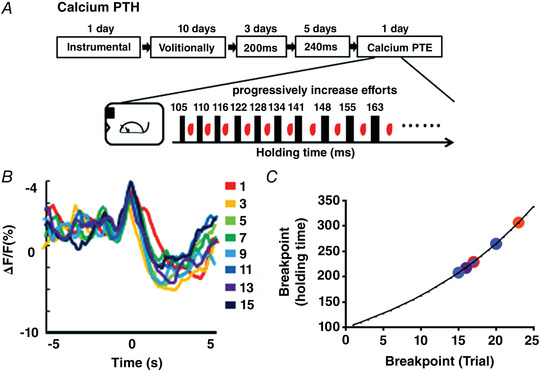
Figure 2. Development of Calcium PTH for detecting volitional motivation.

A, scheme of the training procedure for Calcium PTH. The upper panel indicates the scheme of the training procedure for Calcium PTH. The lower panel indicates the holding time of the sequential trial for the Calcium PTH test. B, the calcium fluorescence signal change in M1 neurons before/after the reward delivery (± 5 s) for escalating efforts (trials 1, 3, 5, 7, 9, 11, 13 and 15) in Calcium PTH testing (n = 6). C, the breakpoint (the maximal holding time) distribution of six mice by the Calcium PTH test (n = 6). [Colour figure can be viewed at wileyonlinelibrary.com]
