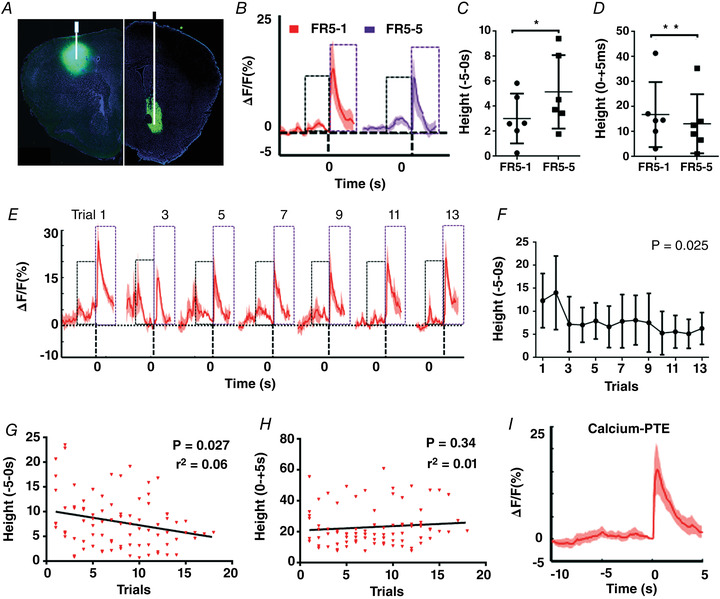
Figure 5. Analysis of the dopamine dynamics in the NAc for calcium PTE.

A, illustration of GCaMP6f‐expressing loci in M1 (left) and GRABDA sensor‐expressing loci in NAc (right) (n = 6). The expression of GCaMP6f in M1 was only used for the volitionally controlled neural task. B, mean dopamine dynamics changes (ΔF/F) before (10 s) and after (5 s) the reward presentation for FR5‐1 and FR5‐5 training. C, mean ‘height’ before (−5) the reward presentation is higher in FR5‐5 training (P = 0.029). D, mean ‘height’ after the reward (+5) presentation is lower in FR5‐5 (P = 0.009). E, mean dopamine dynamic changes before (10 s) and after (5 s) the reward presentation in the Calcium PTE test for the last 13 trials (aligned to the last trial). F, mean ‘height’ for each trial before (5 s) the reward delivery in the Calcium PTE test (RM one‐way ANOVA, P = 0.025, F 2.960, 14.80 = 4.182). G–I, correlation analysis of the dopamine dynamics for the reward prediction (F, P = 0.027, r 2 = 0.06) and reward value (G, P = 0.34, r 2 = 0.01) with the volitional efforts in Calcium PTE. H, mean dopamine dynamic changes before (10 s) and after (5 s) the reward delivery in the Calcium PTE test. ‘0’ represents the reward delivery; ‘height’ represents the highest peak of dopamine dynamics of ±5 s of reward delivery. The black box indicates the prediction signal, and the purple box indicates the reward value signal. [Colour figure can be viewed at wileyonlinelibrary.com]
