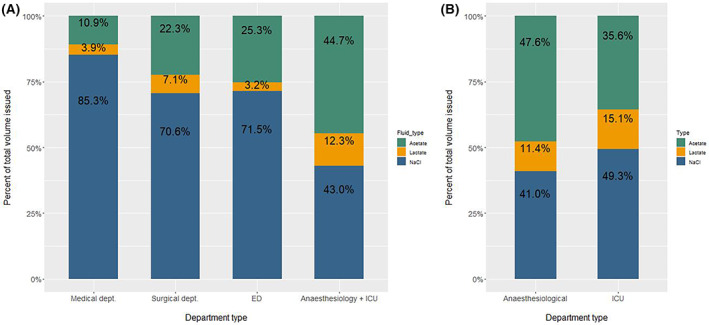
FIGURE 5.

(A) Percentwise distribution of different isotonic crystalloid solutions across different department types*. (B) Percentwise distribution of different isotonic crystalloid solutions in anaesthesiological departments and ICUs separately. *We could not account for the further distribution of fluids from common regional stocks (to which 186,130 L of fluid were issued throughout the study period equivalent to 12.5% of the national volumes issued). Hence, fluids from these stocks are not accounted for at departmental level. Furthermore, some departments could not be categorised as a medical or surgical department, as they were combined (e.g., medical and surgical gastroenterology department).
