Figure 3.
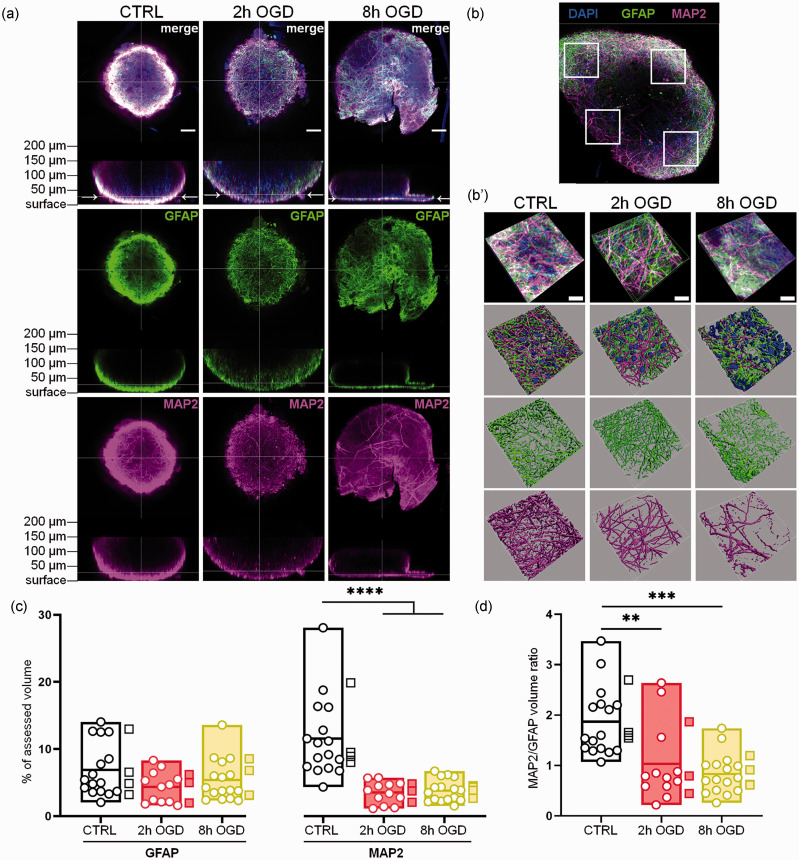
Neuron and astrocyte immunostaining analysis in whole-mounted hCO. Whole-mount immunostaining for MAP2 and GFAP was done in control, 2 h or 8h OGD-treated hCO and imaged at T72. (a) Overview images of GFAP (green) and MAP2 (magenta) fluorescent signal distribution in whole hCO, showing xy and xz focal planes. Arrows in the xz focal planes indicate the focal level where most of the fluorescent signal was observed based on light penetration. Nuclei are stained in blue by Hoechst 33258. Scale bars 50 µm. (b) Typical distribution of the four randomly selected areas (white squares) used for analysis at 40x magnification. (b′) Representative 40x images of GFAP and MAP2 signals in the selected areas and their 3D reconstruction by isosurfaces. Scale bars 20 µm. (c) Quantification of GFAP and MAP2 signal volumes reported as percentages of the total hCO volume analyzed and (d) Ratio of MAP2 to GFAP signal volumes. Data shown as floating min-to-max bars with line at mean. Round symbols indicate individual 40x fields of view (n = 12–16) from 3-4 hCO per group (mean value per hCO indicated by the square symbols). Two-way RM ANOVA followed by Sidak’s multiple comparisons, ****p< 0.0001 (c) or Kruskall-Wallis test, **p < 0.01, ***p < 0.001 (d).

