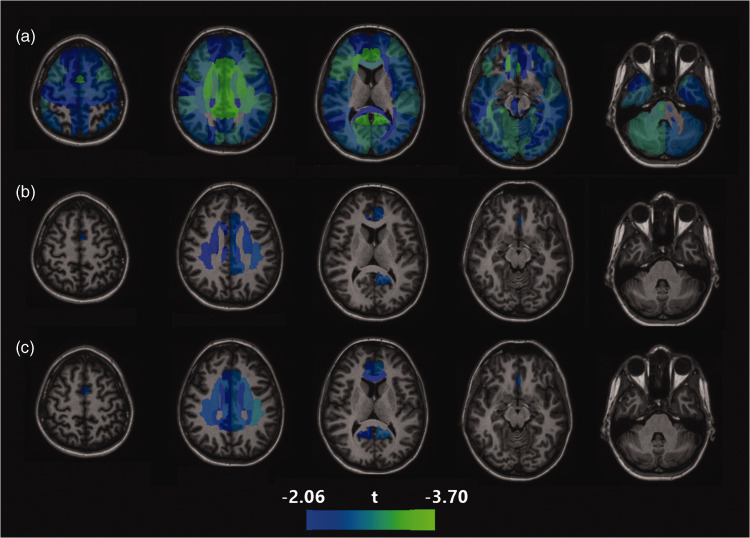
Figure 4.
Areas of negative correlations between regional CBF and trait depression in (a) full sample; (b) sample with participants on antidepressants removed and (c) sample with participants on antidepressants or experiencing current depressive episode removed. The range for colored regions is based on t score for the regression coefficients for analysis A, with the lower limit based on the minimum t score significant after correction for multiple comparisons, and the upper limit based on the highest t score found in the set of analyses.

