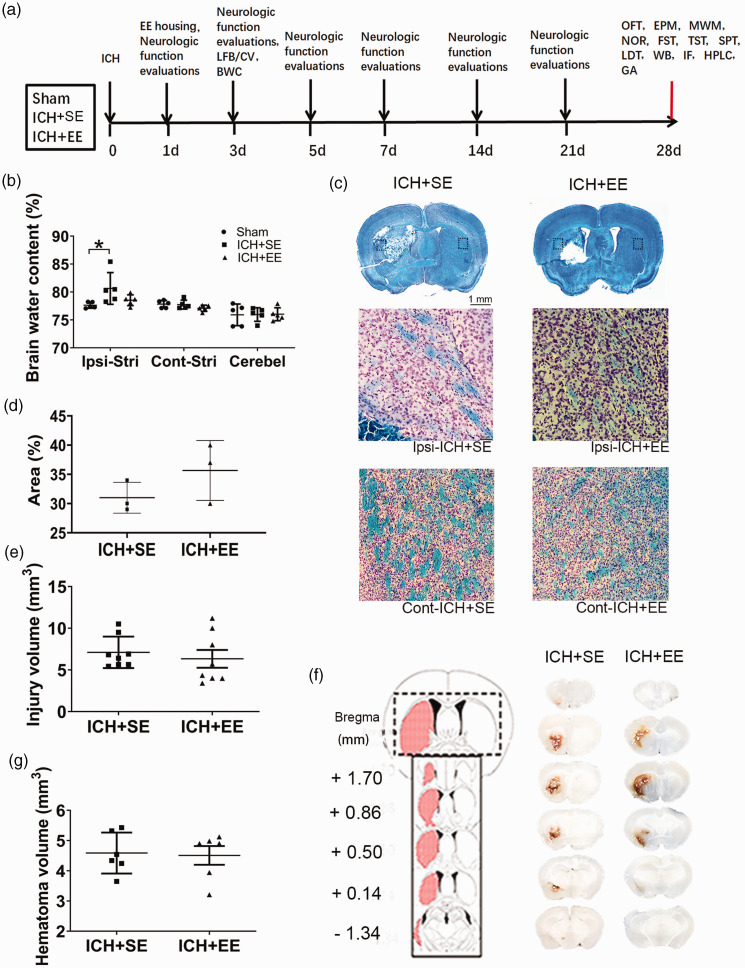
Figure 1.
Enriched environment (EE) has no effect on acute brain injury after ICH. (a) Experimental design. The timeline shows the sequence of all behavioral tests and experimental procedures, beginning on the day of surgery (day 0). LFB: Luxol fast blue; CV: Cresyl violet; BWC: Brain water content; OFT: open field test; EPM: elevated plus-maze; MWM: Morris Water Maze; NOR: novel object recognition; FST: forced swim test; TST: tail suspension test; SPT: sucrose preference test; LDT: light/dark transition test; WB: western blot; IF: immunofluorescence; HPLC: high-performance liquid chromatography; GA: glutaminase activity. (b) On day 3 after ICH, mice exposed to EE did not reduce brain water content in the ipsilateral hemisphere compared to mice that received ICH and standard conditions (ICH + SE). n = 5 mice/group. p > 0.05 vs. the sham group (one-way ANOVA followed by Bonferroni’s post hoc test). Cont-Stri, contralateral striatum; Ipsi-Stri, ipsilateral striatum; Cerebel, cerebellum. (c) Top: Representative Luxol fast blue/crystal violet-stained brain sections of the ICH + SE and ICH + EE groups (scale bar = 1 mm). Bottom: High magnifications of the dashed areas in the top photograph on the ipsilateral and contralateral side (Scale bar= 50 μm) (d) The plot graph shows EE did not increase the percentage of areas with normal myelin after ICH on day 3. n = 3 mice/group (t-test). (e) Quantification analysis did not show differences in brain injury volume between the ICH + SE and ICH + EE groups. n = 8 mice/group (t-test). (f) Left: Schematic illustration of the spatial extent of the hemorrhagic lesion 72 h after microinjection of collagenase VII into the left striatum. Right: Representative fresh brain sections show hematomas (red areas) in mice exposed to standard conditions or EE and (g) Quantification analysis did not show differences in hematoma volume between the ICH + SE and ICH + EE groups. n = 6 mice/group (t-test). Data are expressed as mean ± SD.

