
Fig. 5.
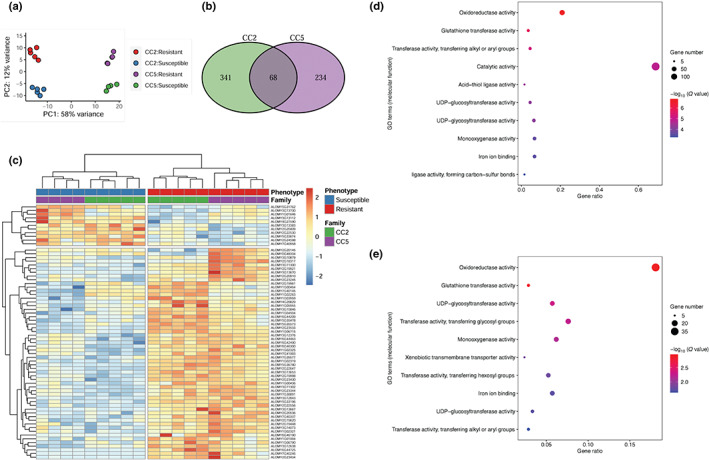
Differential gene expression analysis of the A. myosuroides seed families CC2 and CC5, segregating for the NTSR herbicide‐resistant trait. (a) Principal component analysis using all gene expression data. (b) Numbers of differentially expressed genes (DEGs) comparing the ‘R’ (green) and ‘S’ (purple) groups within each family. (c) Heatmap and hierarchical clustering of the 68 DEGs consistently associated with NTSR across both seed families. (d, e) Gene ontology terms, significantly overrepresented in the CC2 and CC5 families, respectively. The significant levels were Bonferroni‐adjusted to account for multiple testing.