Figure 4.

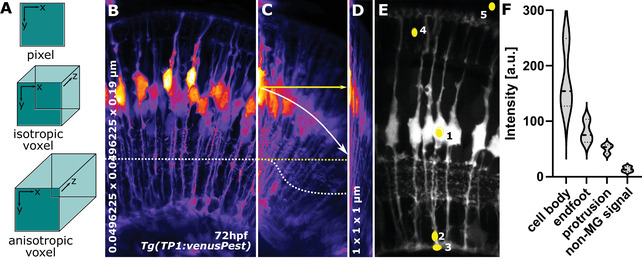
(A) Pixel and voxel properties. (B) MIP of MG at 72hpf with an isotropic resolution of 0.0496225 × 0.0496225 × 0.19 μm (x,y,z, respectively). The dotted line indicates homogenous signal distribution across the x‐axis. (C) Image (B) but horizontally resliced, showing signal decay across z‐axis (white dotted line, yellow dotted line would be the ideal) and displaying image angle (white arrow, with yellow, are being the ideal). (D) Image (B) but with voxel properties being artificially altered to 1 × 1 × 1 μm. (E) ROI for CNR and SNR quantification.
