Figure 7.

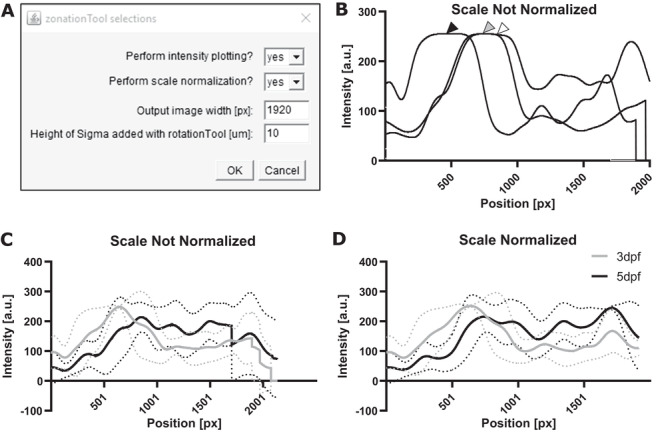
ZonationTool overview. (A) GUI of the zonationTool. (B) Example of plots from three different images, where gray and white arrowhead indicate overlap, and the black arrowhead indicates that cell bodies in this sample are not aligned with the others. (C,D) Same data plotted without and with scale normalization, respectively.
