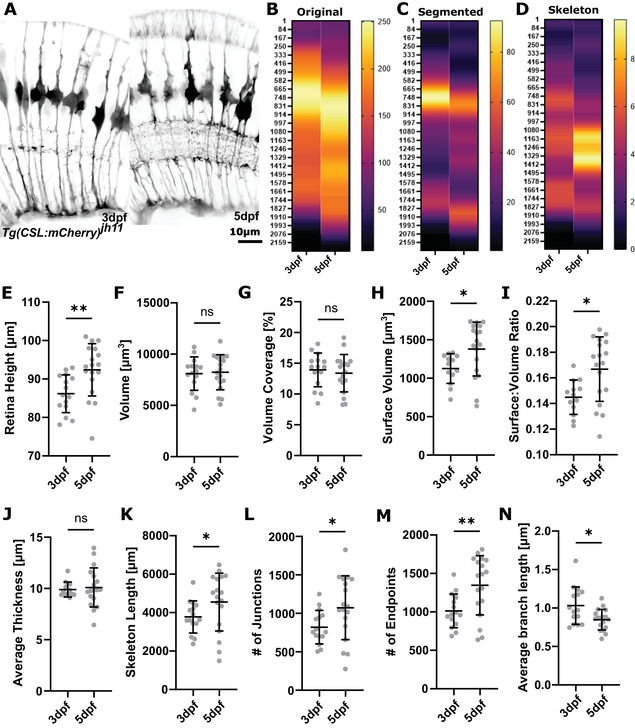
Figure 10.

Example results. (A) Micrographs of representative SubregionTool output image at 3dpf and 5dpf (input for segmentation and quantification). (B‐D) Heatmaps showing the apicobasal texture of the original, segmented, and skeletonized image. (E‐N) Whole‐image quantification outputs.
