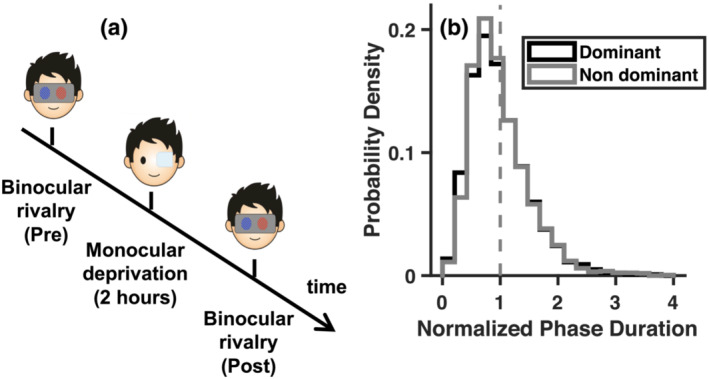
FIGURE 1.

Experimental procedure and baseline binocular rivalry measurements. (a) Time course of the experiment, where binocular rivalry dynamics were measured before and after deprivation. Short‐term monocular deprivation was achieved by applying a translucent patch over the dominant eye for 2 h. (b) Probability density function of the normalised phase durations for each eye (dominant and non‐dominant), measured before deprivation and pooled across conditions and participants. The function conforms to the typical gamma distribution
