
FIGURE 3.
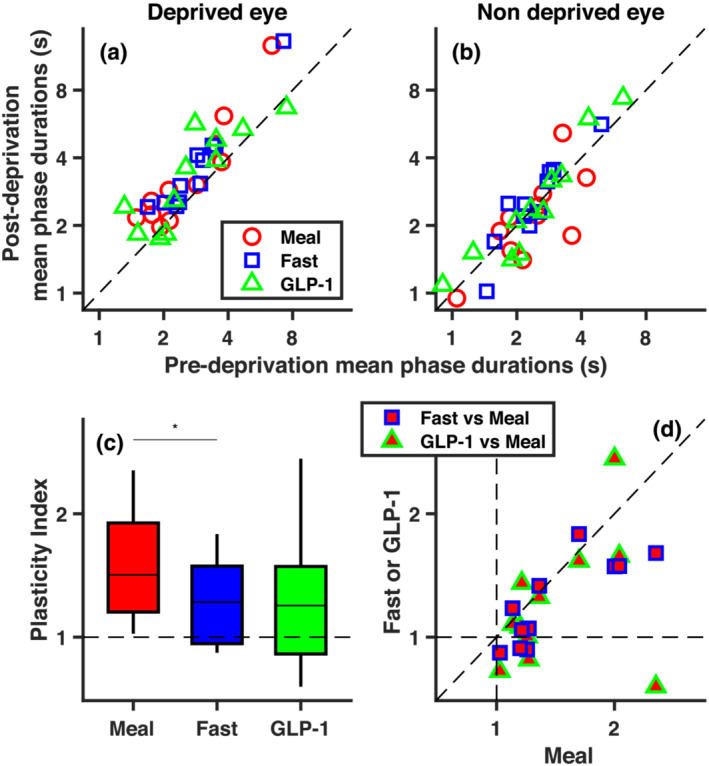
Short‐term ocular dominance plasticity effect. (a, b) Post deprivation vs. pre deprivation mean durations of exclusive dominance phases of the deprived (a) and non‐deprived eye (b), for each participant and for the three metabolic conditions. (c) Box plot of plasticity indices (computed with Equation 1 and summarising ocular dominance shifts following monocular deprivation) in the three conditions. The asterisk above the horizontal lines highlights the only significant paired t test (* for p < .017, corresponding to Bonferroni‐corrected .05 alpha level). (d) Plasticity indices from individual participants in the fasting and GLP‐1 conditions, plotted against plasticity indices in the standardised meal condition. In Figure 3a,b and d, symbols give individual participants results