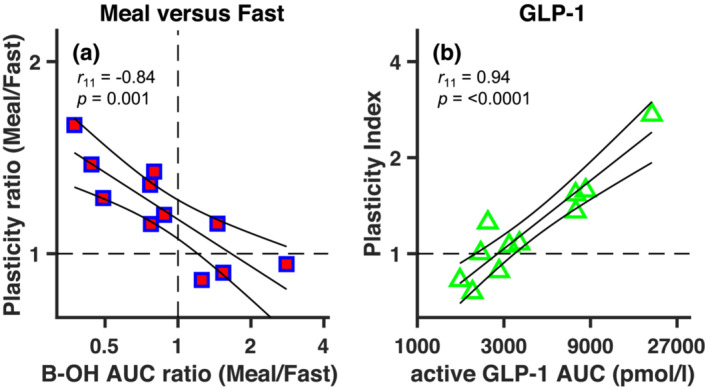
FIGURE 4.

Relationship between metabolic parameters and ocular dominance plasticity. (a) The ratio of plasticity index values in the standardised meal and the fasting condition (y axis) is negatively correlated with the ratio in plasma concentrations of B‐OH (quantified as AUCs) in the two conditions. (b) The plasticity index in the GLP‐1 infusion condition is positively correlated with the plasma concentration of active GLP‐1 (AUCs) in the same condition. In all panels, symbols give individual participants results and continuous lines show the linear regression through the points with associated 95% confidence intervals
