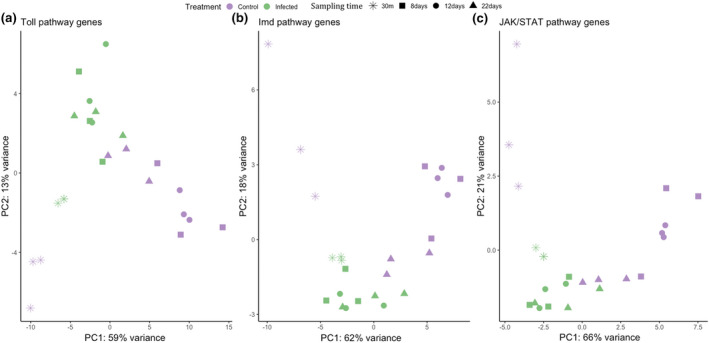
FIGURE 1.

Principal component analyses of expression levels from the three immune pathways (a: Toll, b: Imd, c: JAK/STAT). Results have been colour coded depending on the mosquito condition: Green infected; purple control. Different sampling times are shown with different shapes
