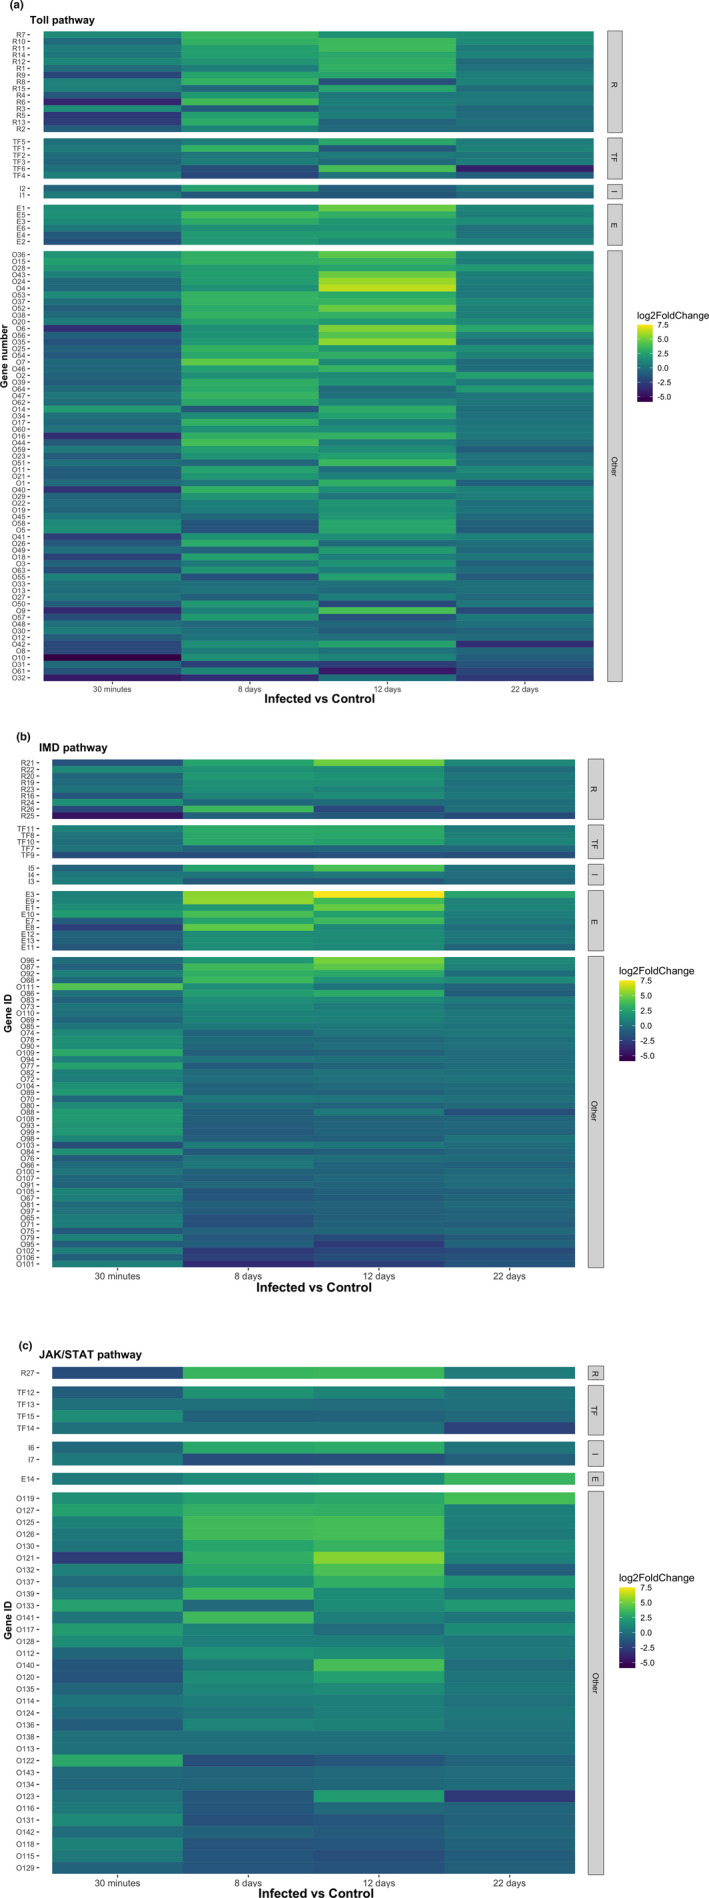
FIGURE 3.

Heatmaps for the different pathways showing log‐fold change (LFC) values resulting from the statistical comparison of infected vs. control mosquitos at each sampling time (a: Toll, b: Imd, c: JAK/STAT). LFC values were classified as follows: Receptors (“R”), transcription factors (“TF”), inhibitors (“I”), effectors (“E”) and “other” (grouping all other genes within the pathway)
