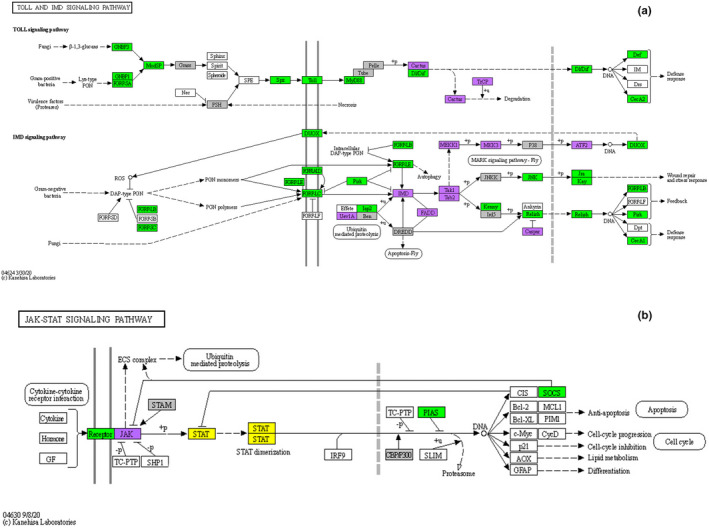
FIGURE 4.

Differentially expressed genes (DEGs) at 8 dpi (peak oocyst) and 12 dpi (peak sporozoite) mapped onto the KEGG toll and Imd signalling pathways of Drosophila melanogaster (Kanehisa et al., 2021) (a), and JAK/STAT pathway adapted from the Homo sapiens sapiens pathway (Kanehisa et al., 2021) (b). Green: Genes up‐regulated in infected mosquitoes as compared to control mosquitoes. Purple: Genes down‐regulated. Grey: no significant difference in expression but with observed expression in the data. White: Genes not present in our analysis. Yellow: Genes detected but with zero transcripts (TPM) at all sampling times. Genes with N/a values are not plotted (see Tables S1 and S2 for corresponding gene names)
