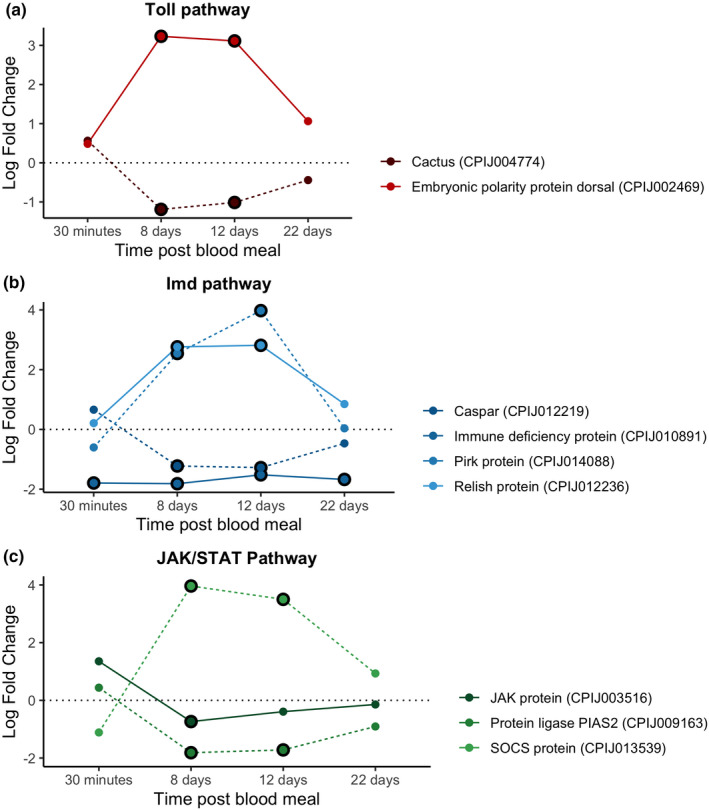
FIGURE 6.

Differential expression pattern of transcription factor and inhibitor genes between infected and control mosquitoes across different sampling points. Differential expression is represented as log‐fold change (LFC) values. (a) Toll pathway, (b) Imd pathway, (c) JAK/STAT pathway. Each colour represents a transcription factor or inhibitor combination. Dark tones and continuous lines indicate transcription factors and soft tones and dashed lines indicate inhibitor genes. Note that each transcription factor has the same colour as its inhibitor (blue, orange or purple). The black circle around each dot indicates a significant difference when comparing infected and control mosquitoes (adjusted p < .05)
