
FIGURE 1.
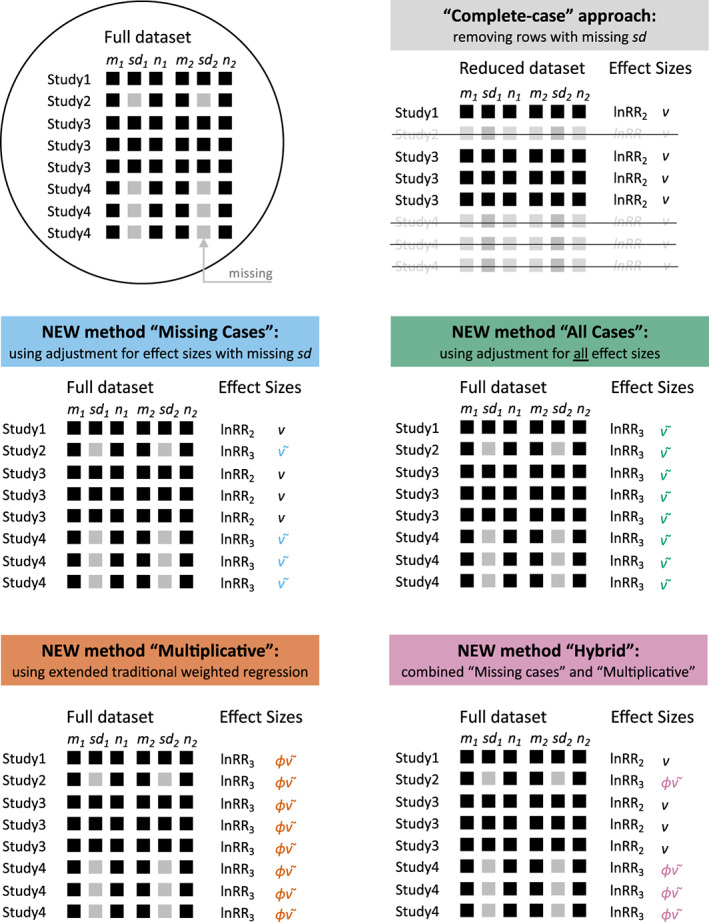
Visual schematics of a hypothetical dataset with missing standard deviations (SDs) and five different approaches used in this study, including 3 new methods. The symbols: lnRR2 (Equation 4), lnRR3 (Equation 6), (Equation 5), (Equation 7), and (Equation 12). Note that, under some circumstances, we could replace Equations 4 and 6 with Equation 1 while Equation 7 can be replaced by Equation 15 (see the text for more details).