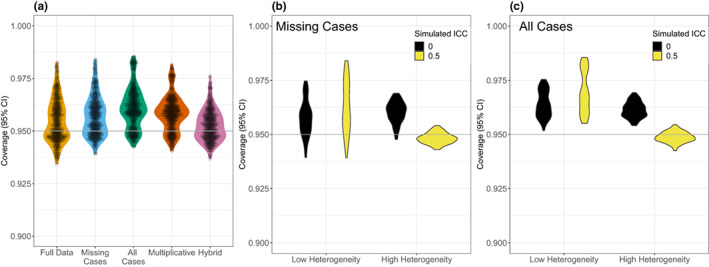
FIGURE 3.

Results on coverage from multi‐level meta‐analytic models: (a) Violin plot showing the distribution of coverage of 95% CIs under each simulated condition as a function of the method used to handle missing data (distribution assuming full data shown for reference). (b) Violin plot showing the distribution of coverage under each simulated condition as a function of the simulated level of total heterogeneity and the ICC for study using the missing‐cases method to handle missing SDs. (c) Violin plot showing the distribution of coverage under each simulated condition as a function of the simulated level of total heterogeneity and the ICC for study using the all‐cases method to handle missing SDs. In (b) and (c), low heterogeneity is τ 2 = 9 × 10⁻⁶ (or τ / θ = 0.01), and high heterogeneity is τ 2 = 0.09 (or τ/θ = 1).
