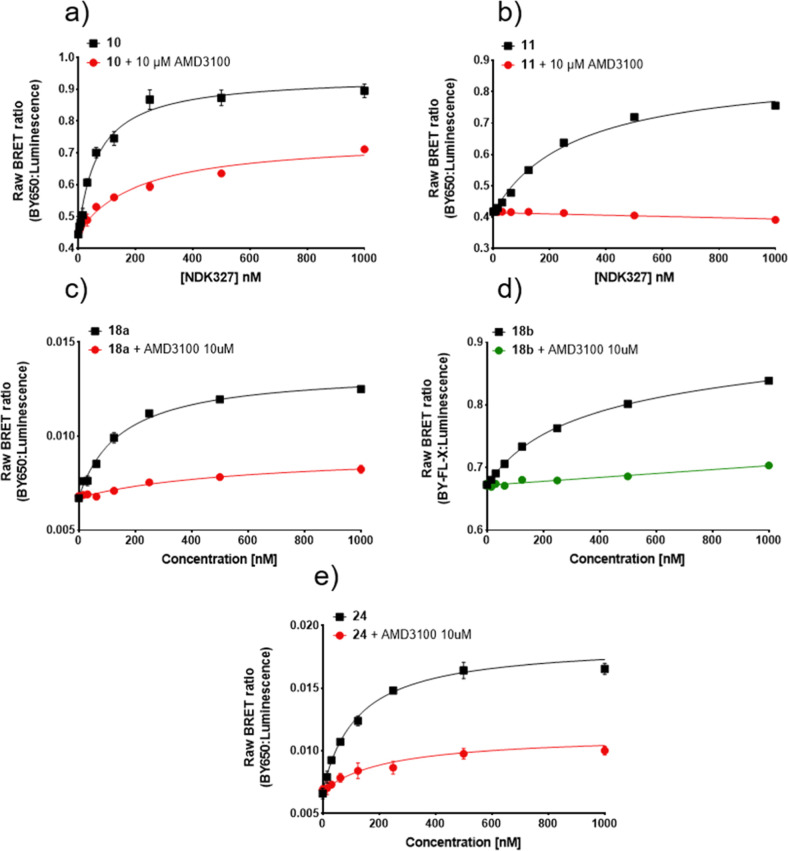
Figure 4.
NanoBRET saturation binding curves measured in HEK293G NLuc-CXCR4 cell membranes for (a) 10, (b) 11, (c) 18a, (d) 18b, and (e) 24. Raw BRET ratio was determined by the ratio of fluorescence/luminescence emissions. Measurements were made in the absence (total binding) and presence of 10 μM AMD3100. For those curves (a,c,e) where the non-specific binding curves obtained in the presence of 10 μM AMD3100 were not linear, pKd values were estimated by fitting the total binding curves to a saturable plus linear component. Data points represent mean ± S.D. of triplicate determinations of a single experiment. These single experiments are representative of 3–5 separate experiments per fluorescent ligand. Where not seen, error bars are within the symbol. White opaque-bottom 96-well plates were used for compounds 10 and 11 (a,b), whereas white clear-bottom 96-well plates were used for compounds 18a, 18b, and 24 (c–e).

