
Figure 3.
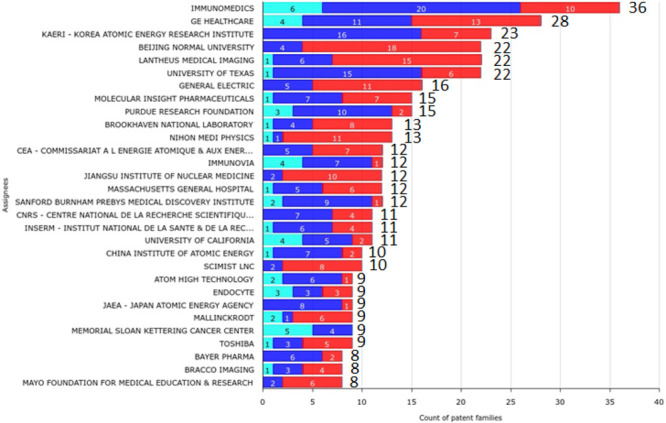
Graph illustrating the 30-top applicants and their related total number of applications in 2000–2022 according to their legal status (light blue, pending; blue, granted; red, dead), adapted from the Questel’s IP Business Intelligence application (Orbit Intelligence).