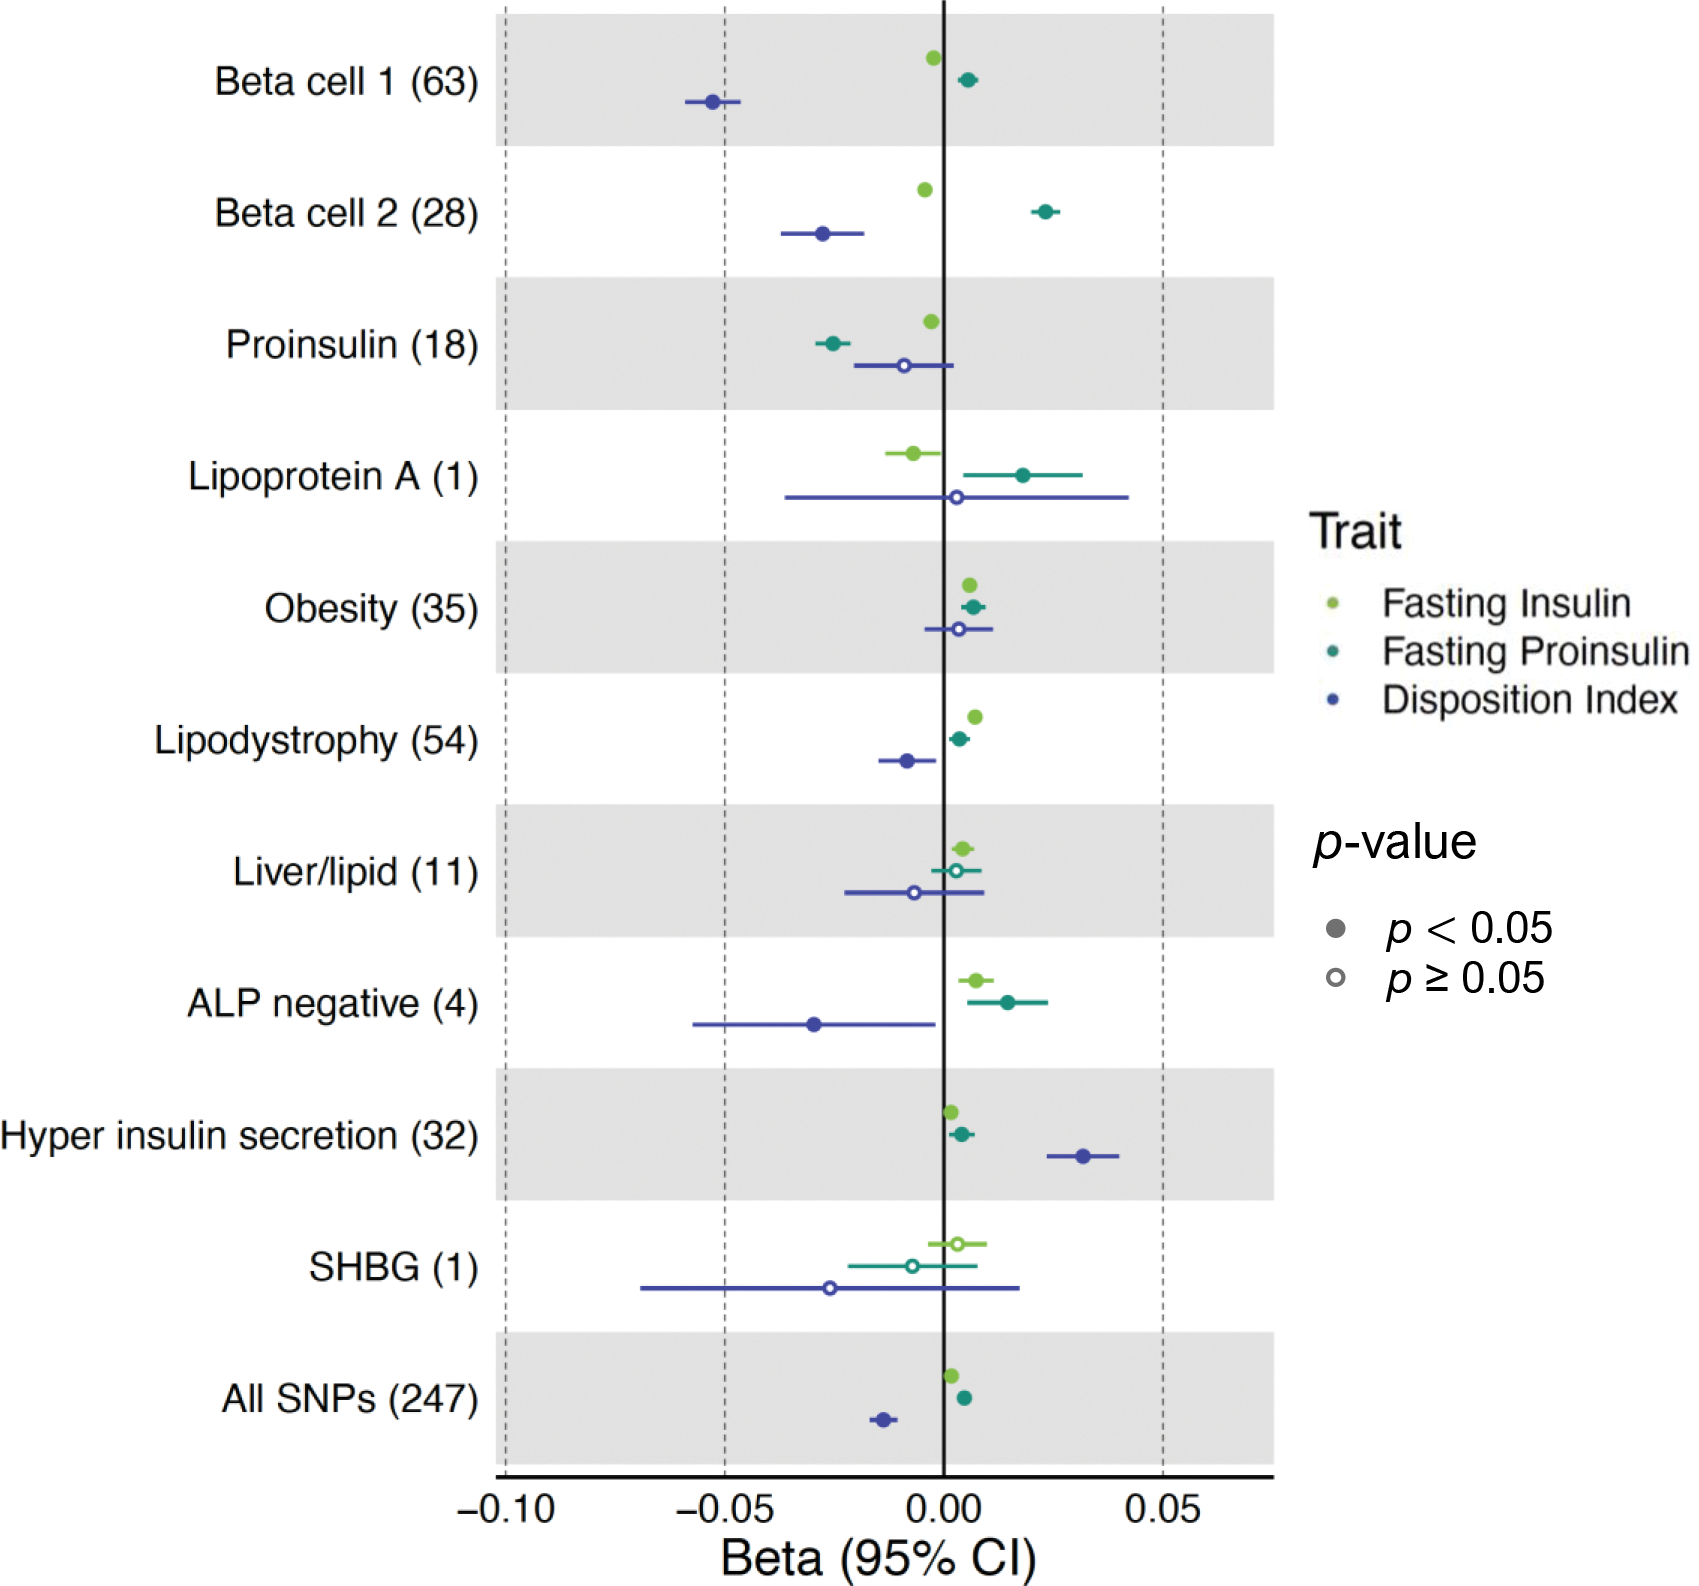
Fig. 1.

Cluster associations with metabolic traits using GWAS. Forest plot showing standardised effect sizes with 95% CI of cluster pPS–trait associations derived from GWAS summary statistics. Three metabolic traits (fasting insulin, fasting proinsulin adjusted for fasting insulin, and DI) that help discriminate clusters are displayed. The numbers in parentheses next to cluster names indicate the number of variants included in the analysis in each cluster. ‘All SNPs’ includes all the variants that are top-weighted in at least one cluster. Filled points indicate p values <0.05
