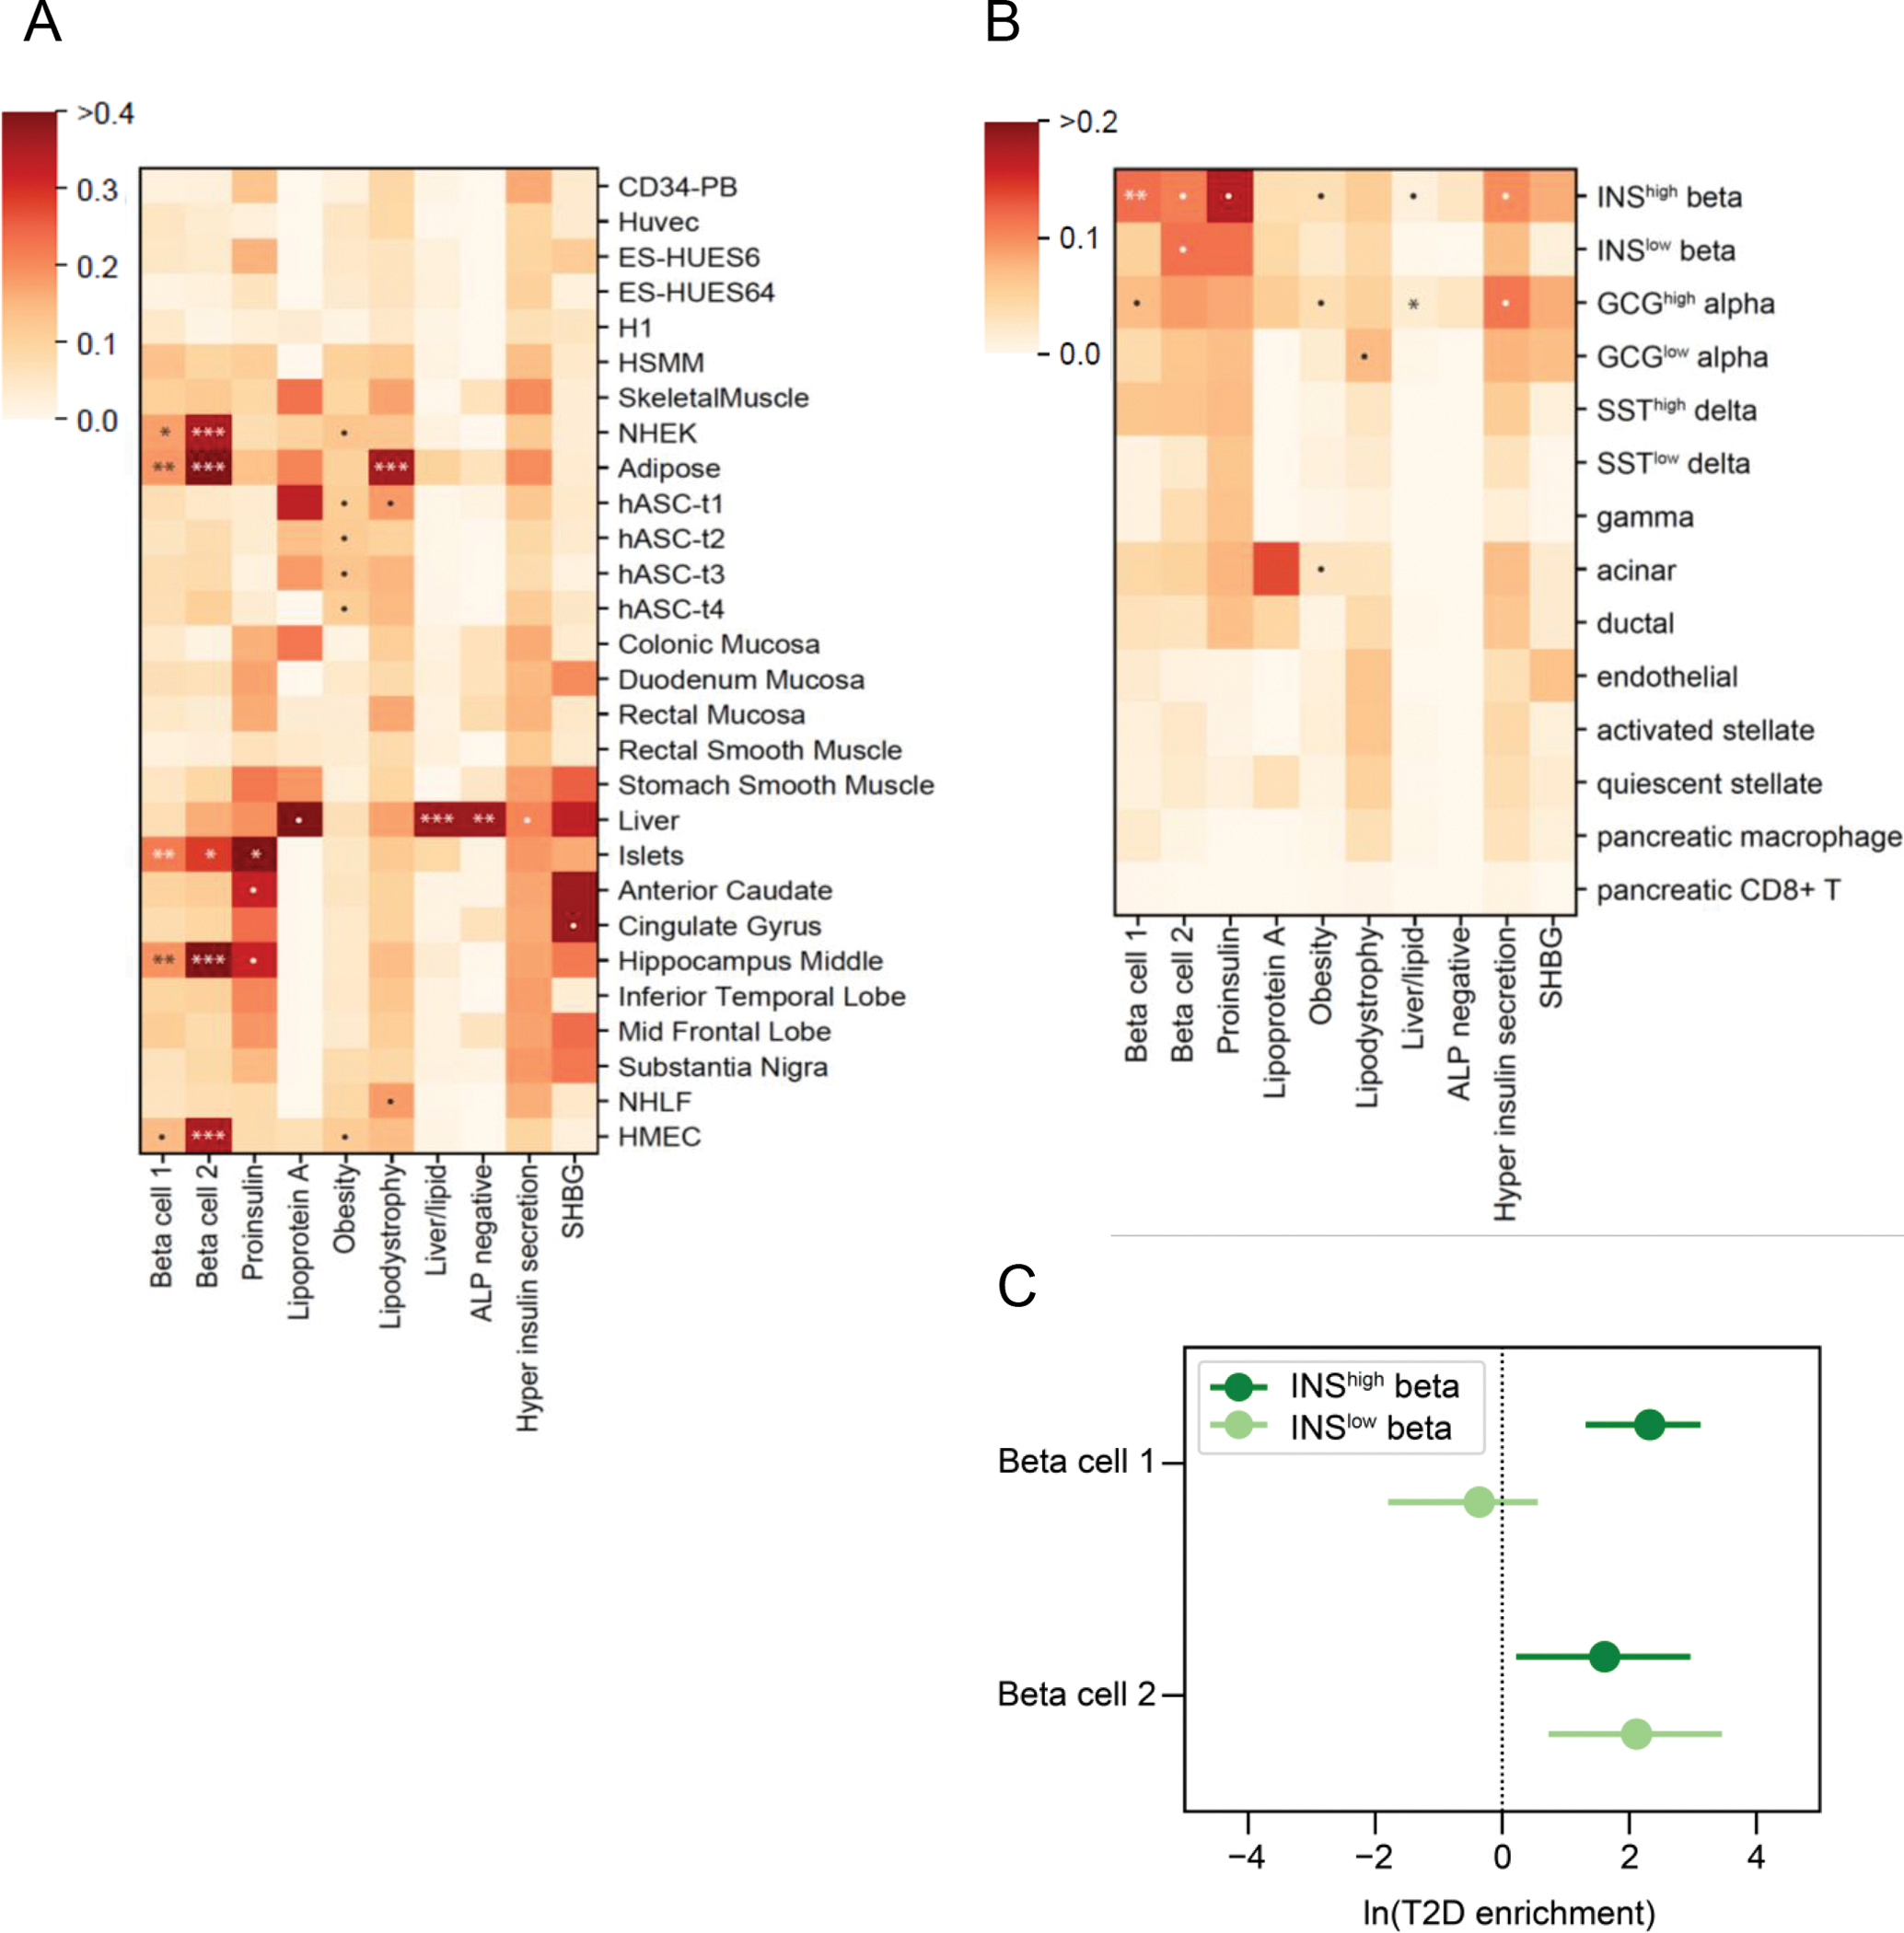
Fig. 3.

Enrichment for tissue-specific enhancers in type 2 diabetes clusters. (a) Heatmap of tissue enhancer/promoter enrichment analysis result. (b) Heatmap of pancreatic islet cell enrichment analysis result. Significance was indicated as follows: *** FDR < 0.001, ** FDR < 0.01, * FDR < 0.1, • p < 0.05. (c) Forest plot of comparison of Beta cell 1 and Beta cell 2 clusters in fgwas enrichment analysis in functional and stressed beta cell states
