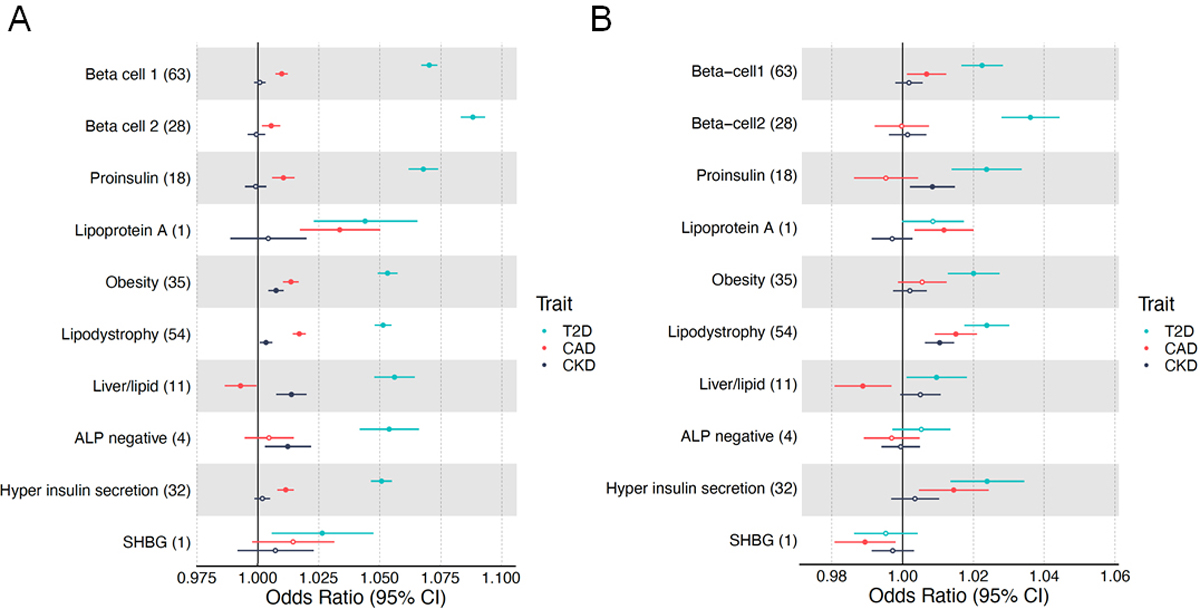
Fig. 4.

Forest plot of cluster associations with outcomes using (a) GWAS and (b) individual-level data from MGB Biobank. (a) Forest plot showing standardised effect sizes with 95% CI of cluster pPS–outcome associations derived from GWAS summary statistics. Three metabolic outcomes (type 2 diabetes, CAD and CKD, all unadjusted for type 2 diabetes) are displayed. The numbers in parentheses next to cluster names indicate the number of variants included in the analysis in each cluster. Filled points indicate p values <0.05. (b) Forest plot of associations of pPSs in individuals in the MGB Biobank with clinical outcomes. Three outcomes including type 2 diabetes are displayed. T2D, type 2 diabetes
