FIGURE 3.

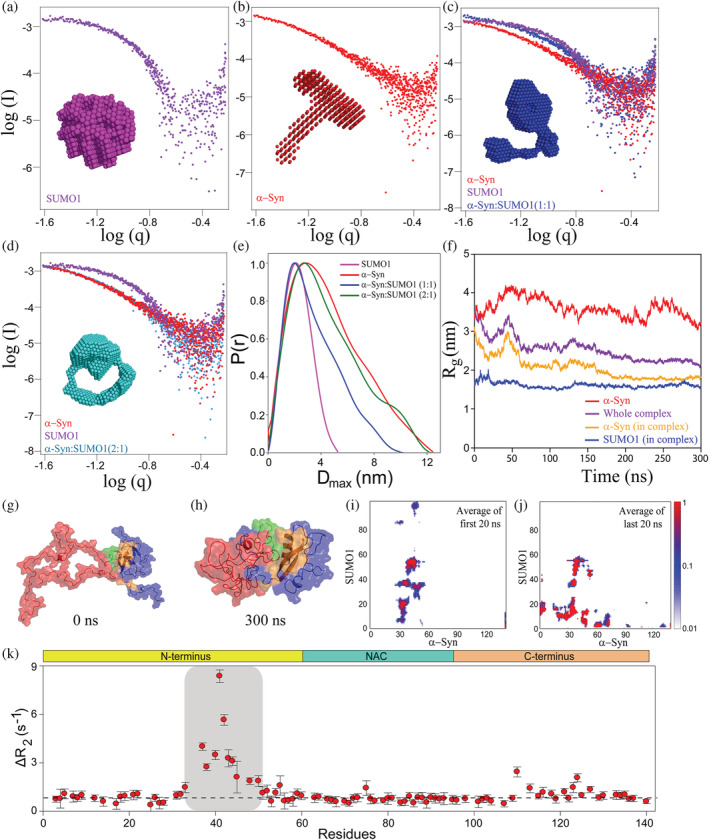
Scattering pattern of α‐Syn and SUMO1 and its complex formed at different ratios by SAXS and molecular dynamic (MD) simulation of docked structure for 300 ns and backbone dynamics of α‐Syn in the presence of SUMO1. Double logarithmic SAXS scattering pattern of SUMO1 (a), α‐Syn (b), and the complex of α‐Syn and SUMO1 obtained by mixing both the proteins at 1:1 (c), 2:1 (d). (e) The distance distribution, P(r) v/s D max curve for the complexes. (f) The radius of gyration of α‐Syn (yellow), and SUMO1 (purple) in the complex, and whole complex (blue), and free α‐Syn (red) over the period of simulation, that is, 300 ns. (g) The structure of the complex was obtained by docking of α‐Syn (red) (structure taken Protein Ensemble Database, PED; PED00024e001) and SUMO1 (blue, PDB; 1A5R) by HADDOCK. It is also the starting structure for the all‐atom Molecular Dynamics simulation. (h) The structure of the complex after 300 ns of MD simulations. The interacting region of SUMO1 and α‐Syn is highlighted in orange and green, respectively. (i) and (j) represent the average contact map of the first and last 20 ns of the 300 ns MD simulations. (k) The differential plot of R 2 of α‐Syn in the presence of SUMO1 from that in the absence of SUMO1. The ΔR 2 was higher for the residues V37‐H50, E110, E123, and A124 as compared to the remaining residues.
