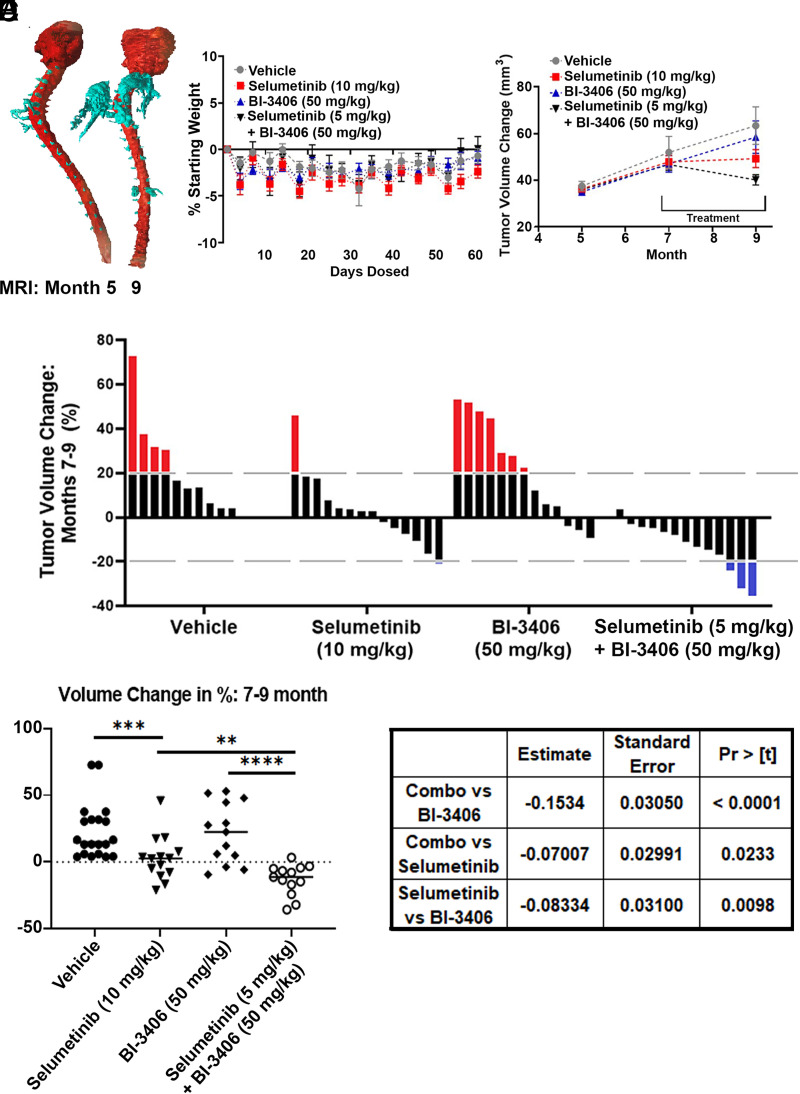
Fig. 3.
Drug efficacy results after 58 days of dosing. (A) Finite element model (FEM) of a representative vehicle-treated mouse depicting tumor growth at 5 months and 9 months. Areas of spinal nerve/dorsal root ganglia and tumor are shown in turquoise; brain and spinal cord are shown in red. (B) Body weight measurements show no significant decrease in body weight. (C) Average tumor volume change per mouse, measured via volumetric MRI analysis. (D) Waterfall plot shows the percent change in tumor volume in individual mice between 7 and 9 months. Change in tumor volume for each mouse is shown as a single bar. Dotted lines show 20% change.

