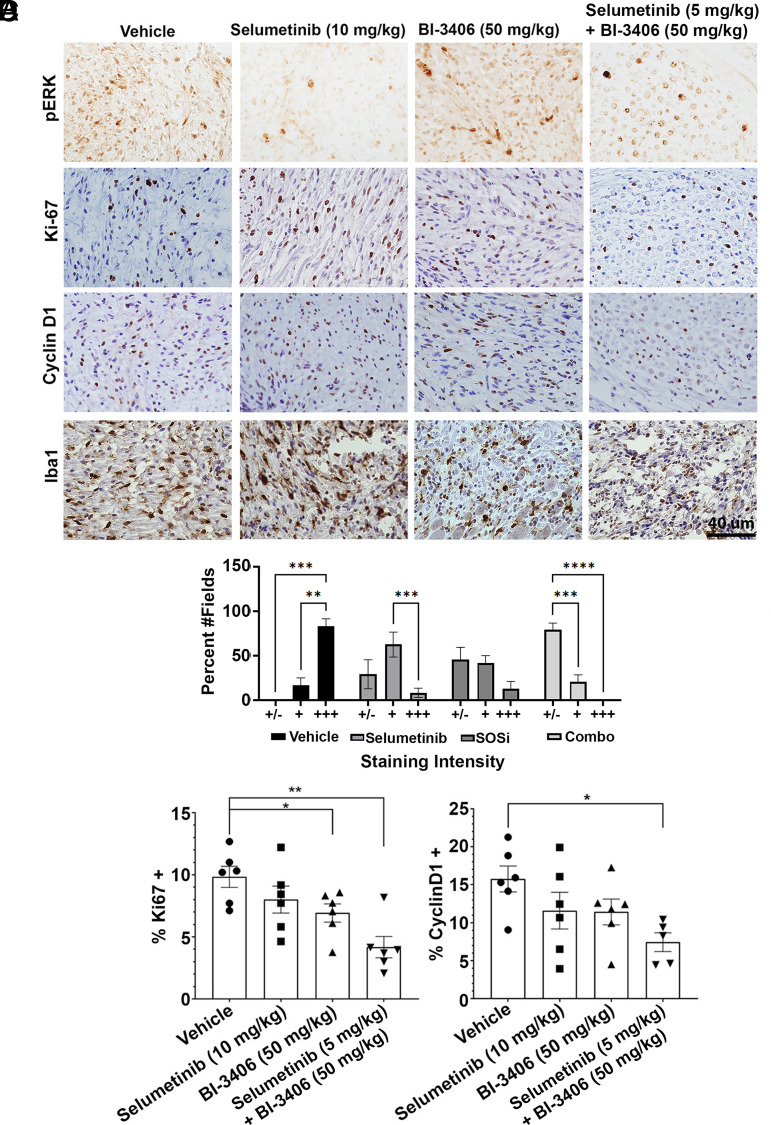
Fig. 4.
Two-month treatment results in sustained reductions in cell proliferation. IHC images and analysis. (A) Representative images of P-ERK, Ki-67, cyclin D1, and Iba1 stained sections. Analysis of P-ERK staining intensity (B). Quantitative analysis of the percentage of cells that are Ki67+ (C) or cyclin D1+ (D). Quantification was as for Fig. 2. Reduced proliferation in the combination treatment is more than in the selumetinib-treated samples.

