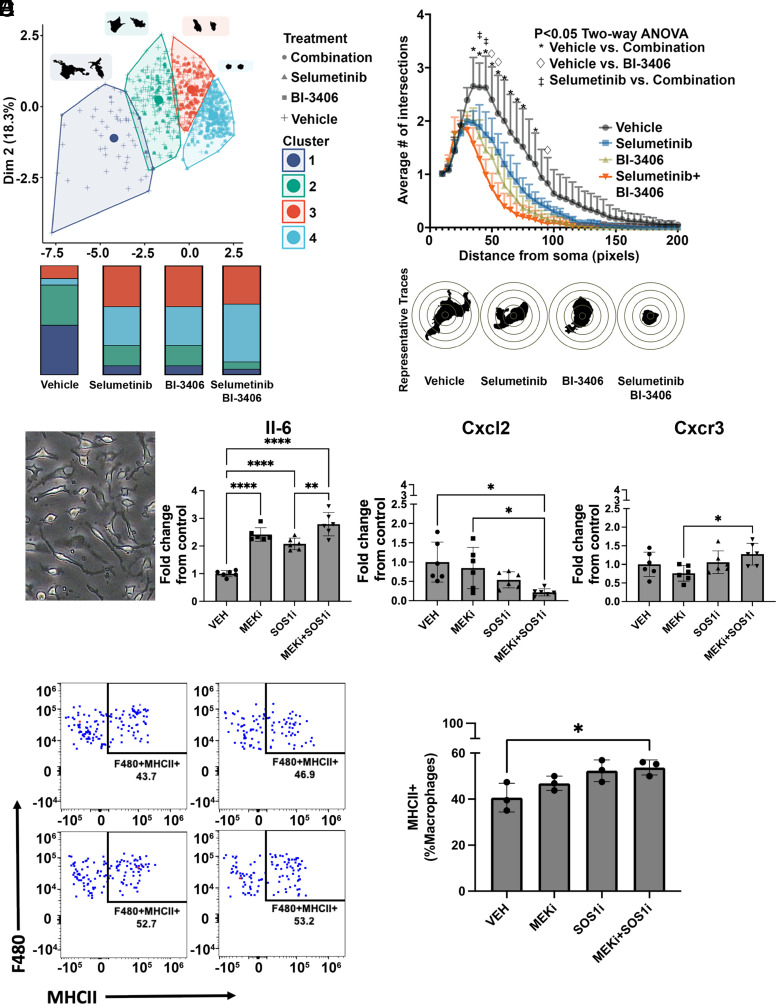
Fig. 5.
Treatment with selumetinib in combination with BI-3406 alters Iba1+ macrophage shape. (A, left) Scatter plot showing clusters (n = 4) of Iba1+ macrophages, defined via K-means cluster analysis based on cell size and cell shape characteristics. Each dot represents data from a single cell in samples of PNF treated with vehicle, selumetinib, BI-3406, or selumetinib and BI-3406. Examples of two cells with characteristic morphology for each cluster are shown in black (A, right). Bar graphs showing the frequency of cells in each cluster for each treatment (B, right). Sholl plot indicates a significant loss of arborization in Iba1+ cells, traced from animals that received selumetinib in combination with BI-3406 when compared with either vehicle-treated (*) or selumetinib-treated (•) animals, (P < 0.05, two-way ANOVA, n = 4, 50–100 cells per animal) (B, left). Traces of cells representative of each treatment condition. (C) Representative phase contrast image of mouse bone marrow–derived macrophages collected from tumor-bearing mice and maintained in defined serum-free medium. (D) Changes in mRNA expression of cytokines after 4-hour treatment with vehicle, selumetinib, BI-3406, or selumetinib + BI-3406. Graphs show significant increases in IL6 and reduced levels of Cxcl2 after combination treatments. Macrophage analysis by Flow cytometry (E and F). Representative plots (G) and quantification (H) of MHCII expression in F480+ macrophages grown for 48 hours with Nf1−/− Schwann cells.

