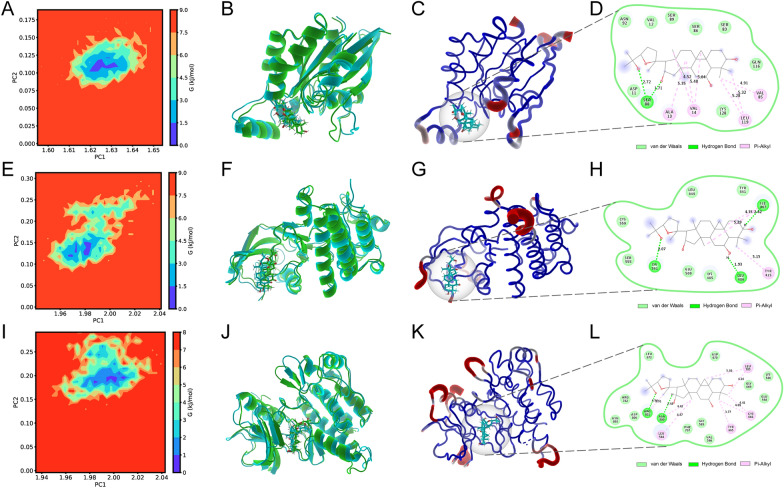
Fig. 7.
Exploration of the conformations with the lowest free binding energy. A The free energy landscape of CA-CDC42 during the 80-ns molecular dynamics simulation. 2D graph projects on the first two principal components (PC1 + PC2). Blue spots indicate the energy minima. B The overlapped graph of CA-CDC42 before (green) and after (blue) molecular dynamics simulation. C The low-energy conformation of CA-CDC42 is selected according to the free energy landscape. D The binding model of CA-CDC42 complex. Light green represents van der Waals, dark green represents hydrogen bonds, and pink represents hydrophobic interactions. E The free energy landscape of CA-PTK2 during the 80-ns molecular dynamics simulation. F The overlapped graph of CA-CDC42 before (green) and after (blue) molecular dynamics simulation. G The low-energy conformation of CA-PTK2 is selected according to the free energy landscape. H The binding model of CA-PTK2 complex. I The free energy landscape of iso-CA-CSF1R during the 80-ns molecular dynamics simulation. J The overlapped graph of iso-CA-CSF1R before (green) and after (blue) molecular dynamics simulation. K The low-energy conformation of iso-CA-CSF1R is selected according to the free energy landscape. L The binding model of the iso-CA-CSF1R complex. M The free energy landscape of CA-CSF1R

