Fig. 8.
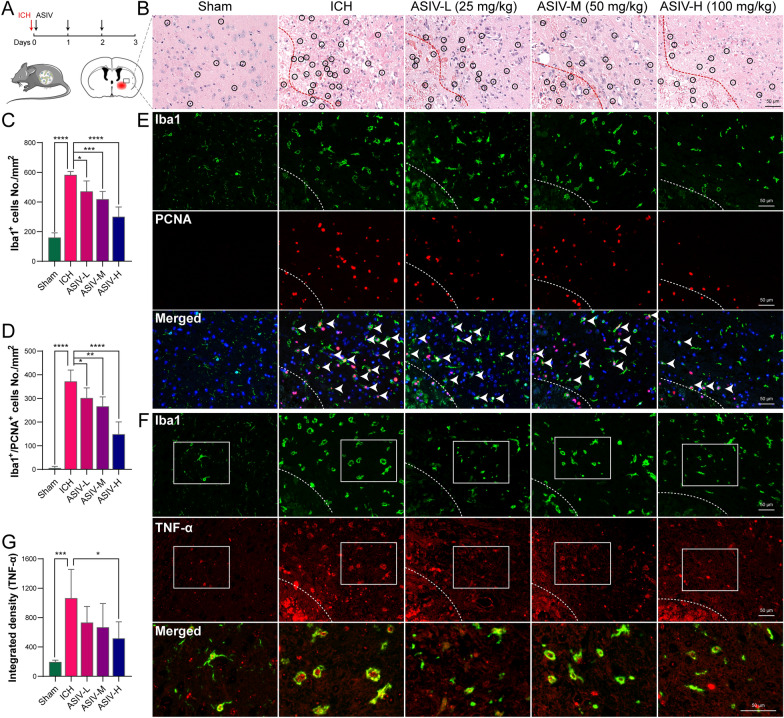
The effects of orally administrated ASIV on microglia/macrophage proliferation, migration, and chemokine secretion after ICH. A Flow chart of the animal experiments. B H&E staining suggests that ASIV alleviates brain disorganization and inflammatory cell infiltration. C The statistic graph of Iba1 immunofluorescent suggests that ASIV dose-dependently reduces the number of perihematomal microglia/macrophages. D The statistic graph of Iba1 and PCNA double staining suggests that ASIV reduces the number of proliferating microglia/macrophage (green cells encircles red nuclei). E The representative images of Iba1 (green) and PCNA (red) immunofluorescent. F The representative images of Iba1 (green) and TNF-α (red) double staining indicate that TNF-α is predominantly expressed by microglia/macrophage. G The statistical graph of TNF-α immunofluorescent suggests that a high dose of ASIV declines TNF-α production. Dashed line: hematoma (B, E, F). Data are expressed as mean ± SD, n = 5. *P < 0.05, **P < 0.01, ***P < 0.001, ****P < 0.0001. Scale bar = 50 μm

