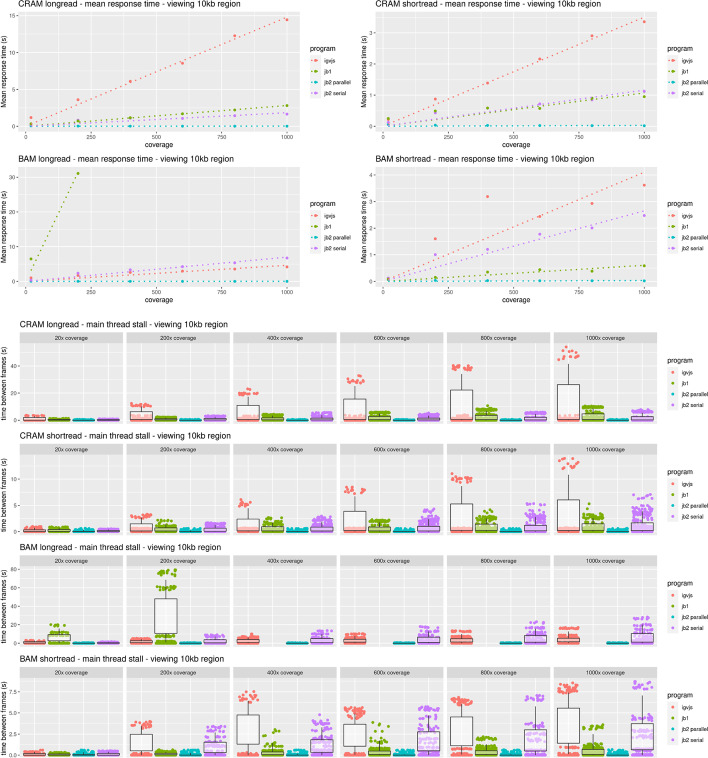
Fig. 10.
JBrowse 2’s parallel rendering strategy yields significant improvements in user interface responsiveness, as reflected in these benchmarks rendering aligned reads of varying coverage and file types in a 10-kb region. We define the response time as the delay, during the rendering phase of the benchmark, from a randomly sampled time point until the time the next frame is rendered. This directly reflects the perceived delay between when a user initiates an action and when the app responds. The response time is a random variable; its expectation gives a sense of average lag, while its variation gives a sense of how unpredictable the user interface delays can be. Panel A plots the expectation of the response time as a function of sequencing coverage. At high coverage, JBrowse 2’s parallel strategy maintains a low response time, in contrast to single-threaded strategies whose response time can grow large, with the perception that the browser is “hanging” or “frozen.” The relationship between response time and coverage is approximately linear for all browsers, as shown by the dotted linear regression fit. The incomplete data for JBrowse 1 on the BAM long read benchmark reflects the fact that the simulation times out (rendering time > 5 min). Panel B shows the same data plotted as a scatterplot of time between frames. The plotted points show the raw time between frame values and are overlaid with boxplots that show the variation in response times (25th and 75th percentiles shown in the boxes, 5th and 95th percentiles shown in the tails). Full details of the benchmark can be found under “Performance and Scalability benchmark details” in the “Methods” section

