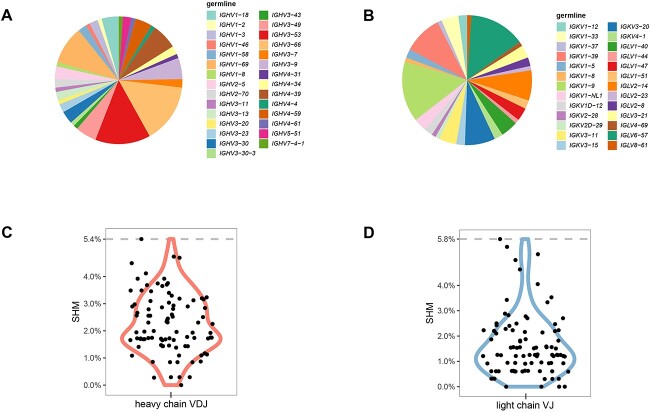
Figure 2.
RBD-ACE2 blocking mAbs sequence analysis. (A) Usage of VH germline genes. The area ratio of each part in the pie chart represents the ratio of the VH germline. (B) Usage of VL germline genes. The area ratio of each part in the pie chart represents the ratio of the VL germline. (C) Violin plot showing somatic hypermutation of heavy chain. Each dot represents the median SHM percentage of mAb’s heavy chain. (D) Violin plot showing somatic hypermutation of light chain. Each dot represents the median SHM percentage of mAb’s light chain.

