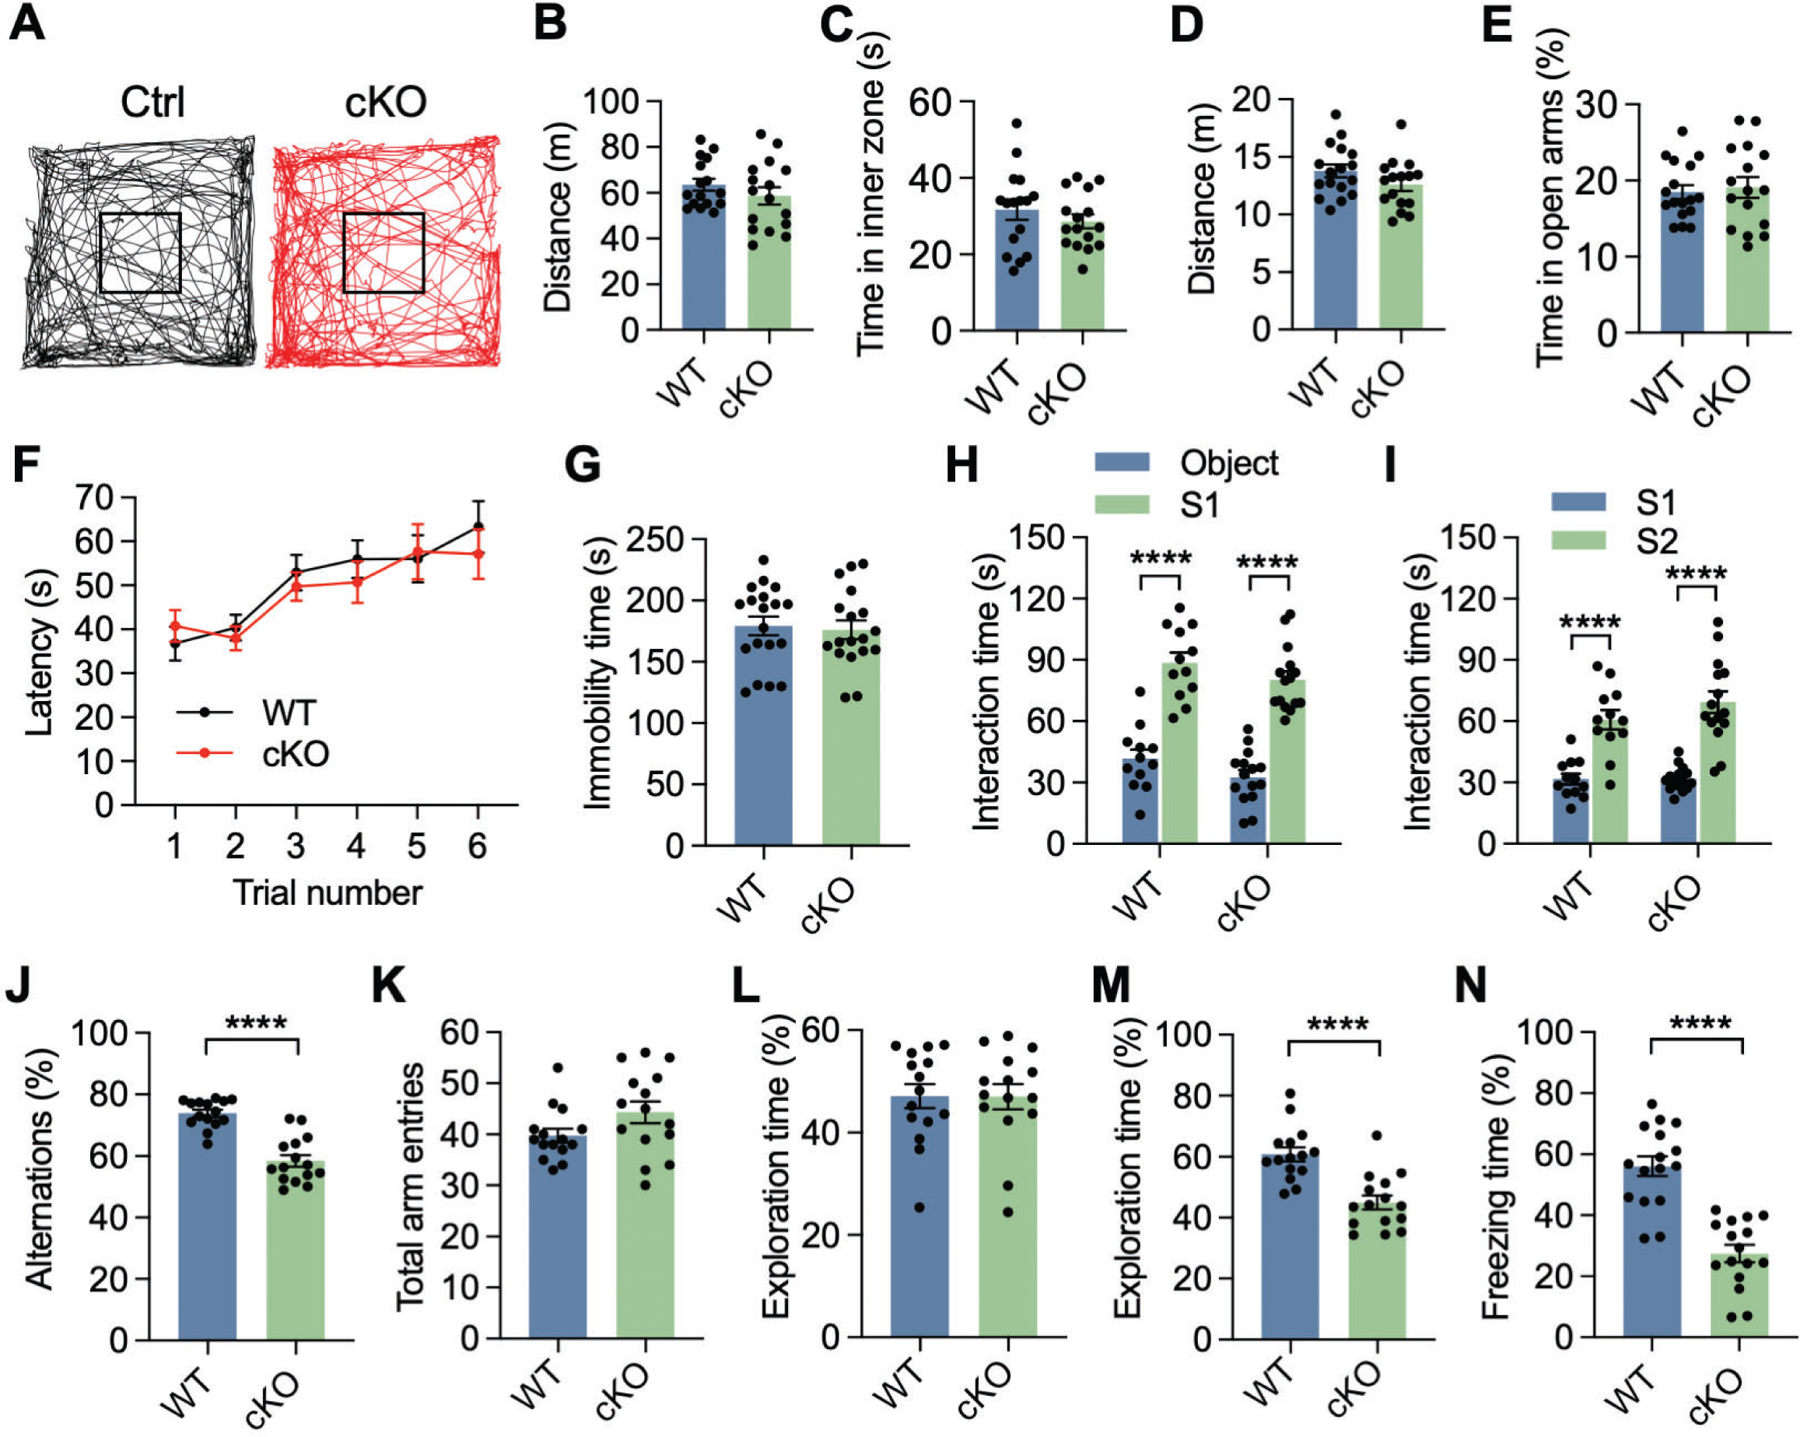
Fig. 1. KDM6B cKO mice display learning and memory-associated behavioral deficits.

(A) Representative traces of locomotor activity in KDM6B cKO mice and control (Ctrl) littermates during the first 10 min of open field test. (B, C) Open field test showing no difference in the moving distance (B) and duration time in the inner zone (C) between KDM6B cKO and WT mice. n = 16 mice per group. Two-tailed Student’s t test. (D, E) Elevated plus maze test showing no difference in moving distance (D) and duration time in the open arms (E) between KDM6B cKO and WT mice. n = 17 (WT mice) and 16 (KDM6B cKO mice). Two-tailed Student’s t test. (F) Accelerating rotarod test showing no difference in the latency to fall off between KDM6B cKO and WT mice. n = 20 (WT mice) and 19 (KDM6B cKO mice). Two-way ANOVA with Tukey’s multiple comparison test. (G) Tail suspension test showing no difference in the immobility time between KDM6B cKO and WT mice. n = 19 (WT mice) and 18 (KDM6B cKO mice). Two-tailed Student’s t test. (H, I) KDM6B cKO mice display normal social interaction in the three-chamber test. The interaction time in the first (H) and second (I) phases was quantified. S1, mouse 1; S2, stranger mouse. n = 12 (WT mice) and 15 (KDM6B cKO mice). Two-way ANOVA with Sidak’s multiple comparison test. (J, K) KDM6B cKO mice display working memory deficits in the Y maze test. Spontaneous alternations (J) and total arm entries (K) were quantified in KDM6B cKO and WT mice. n = 15 mice per group. Two-tailed Student’s t test. (L, M) KDM6B cKO mice display recognition memory deficits in the novel object recognition test. The percentage of the exploration time on a single object during the familiarization (L) and novel object during the test sessions (M) was quantified. n = 15 mice per group. Two-tailed Student’s t test. (N) KDM6B cKO mice display associative learning deficits in the contextual fear conditioning tests. n = 16 mice for each group. Two-tailed Student’s t test. Data were presented as mean ± s.e.m; ****p < 0.0001.
