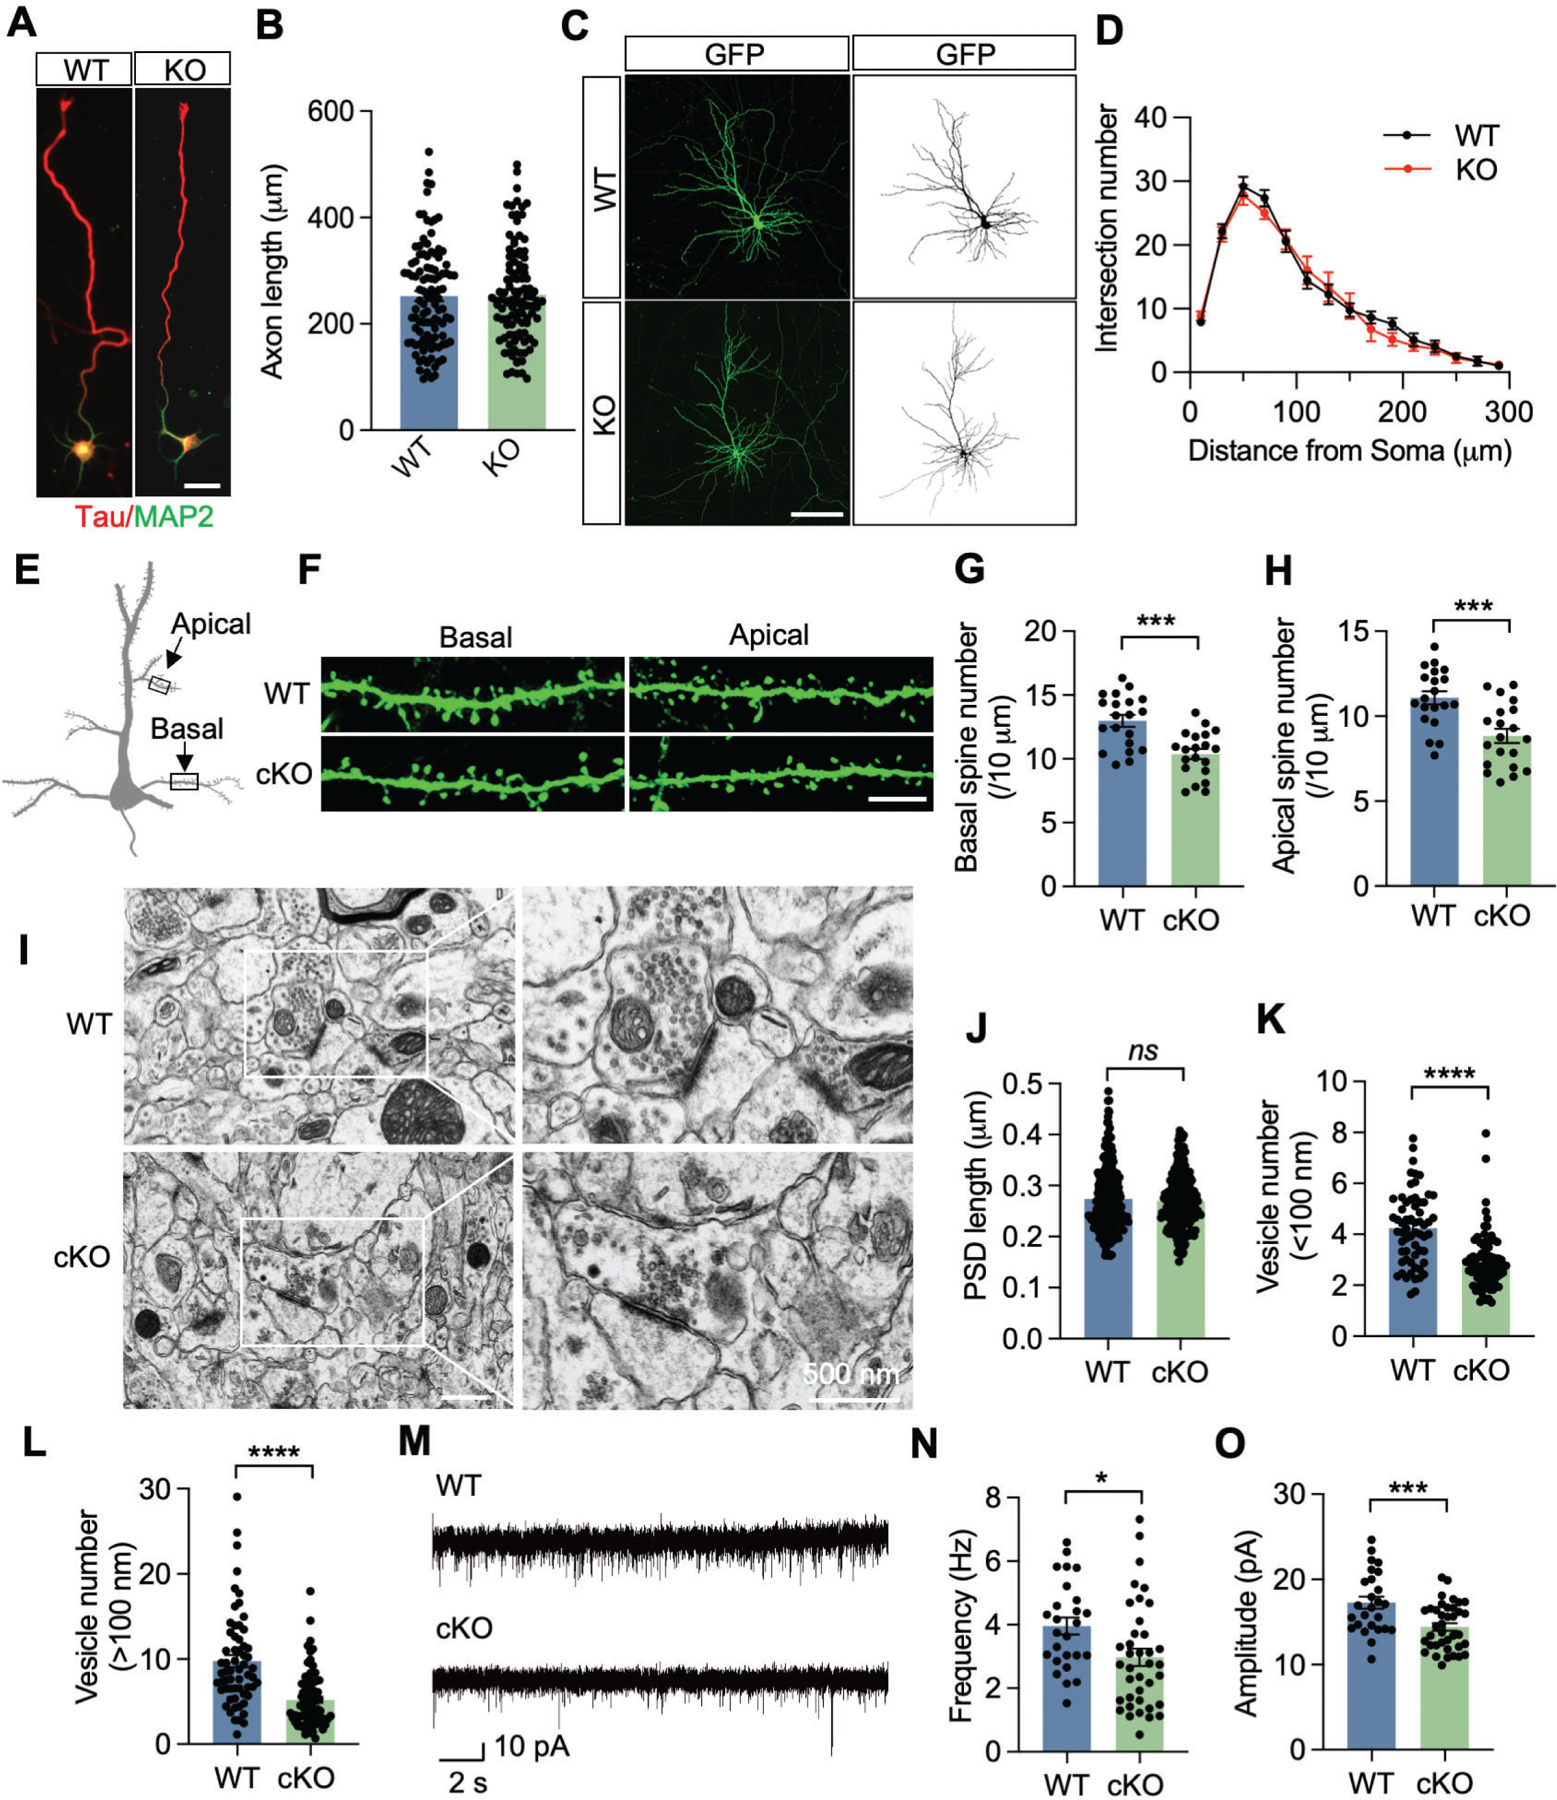
Fig. 2. KDM6B cKO reduces synaptic activity and vesicle numbers in mice.

(A, B) Representative images of primary WT and KDM6B KO cortical neurons at day 3 in vitro (DIV 3, A). Axon was labeled with anti-Tau antibody (red), dendrites was labeled with anti-MAP2 antibody (green). Scale bar, 20 μm. The axon length was quantified (B). Axons of neurons were defined as the longest neurite at that time. n = 105 (WT) and 106 (KDM6B KO). Two-tailed Student’s t test. (C, D) Representative images of primary WT and KDM6B KO cortical neurons at DIV 18 (C). Neurons were transfected at DIV 6 with GFP plasmid and immunostained with anti-GFP antibody at DIV 18 (left). The binary picture (right) was used for Sholl analysis at 20 μm concentric circles around the soma (D). Scale bar, 100 μm. n = 16 neurons for each group. Two-tailed Student’s t test. (E-H) Scheme (E) and representative GFP staining images (F) of basal and apical dendrites of layer 5 pyramidal neurons from WT and KDM6B cKO mice crossed with Thy1-GFP mice. Scale bar, 5 μm. The spine numbers in basal and apical dendrites were quantified in G and H, respectively. n = 20 neurons from 3 WT or KDM6B cKO mice. Two-tailed Student’s t test. (I) Representative electron microscope images of the synaptic contacts with presynaptic vesicles and postsynaptic densities in WT and KDM6B cKO mouse brain. Scale bar, 500 nm. (J) Quantitative analysis of the PSD length. n = 220 synapses from 3 WT mice. n = 211 synapses from 3 KDM6B cKO mice. Two-tailed Student’s t test. ns, not significant. (K, L) Quantitative analysis of synaptic vesicle number in the proximal (K) or distant (L) active zone. n = 61 synapses from 3 WT mice. n = 82 synapses from 3 KDM6B cKO mice. Two-tailed Student’s t test. (M) Representative traces of sEPSCs in layer V pyramidal neurons from WT and KDM6B cKO mice. (N, O) Quantification of sEPSC frequency (N) and amplitude (O). n = 26 cells from 3 WT mice, n = 38 from 5 KDM6B cKO mice; Two tailed Student’s t test. Data were presented as mean ± s.e.m. *p < 0.05; ***p < 0.001; ****p < 0.0001.
