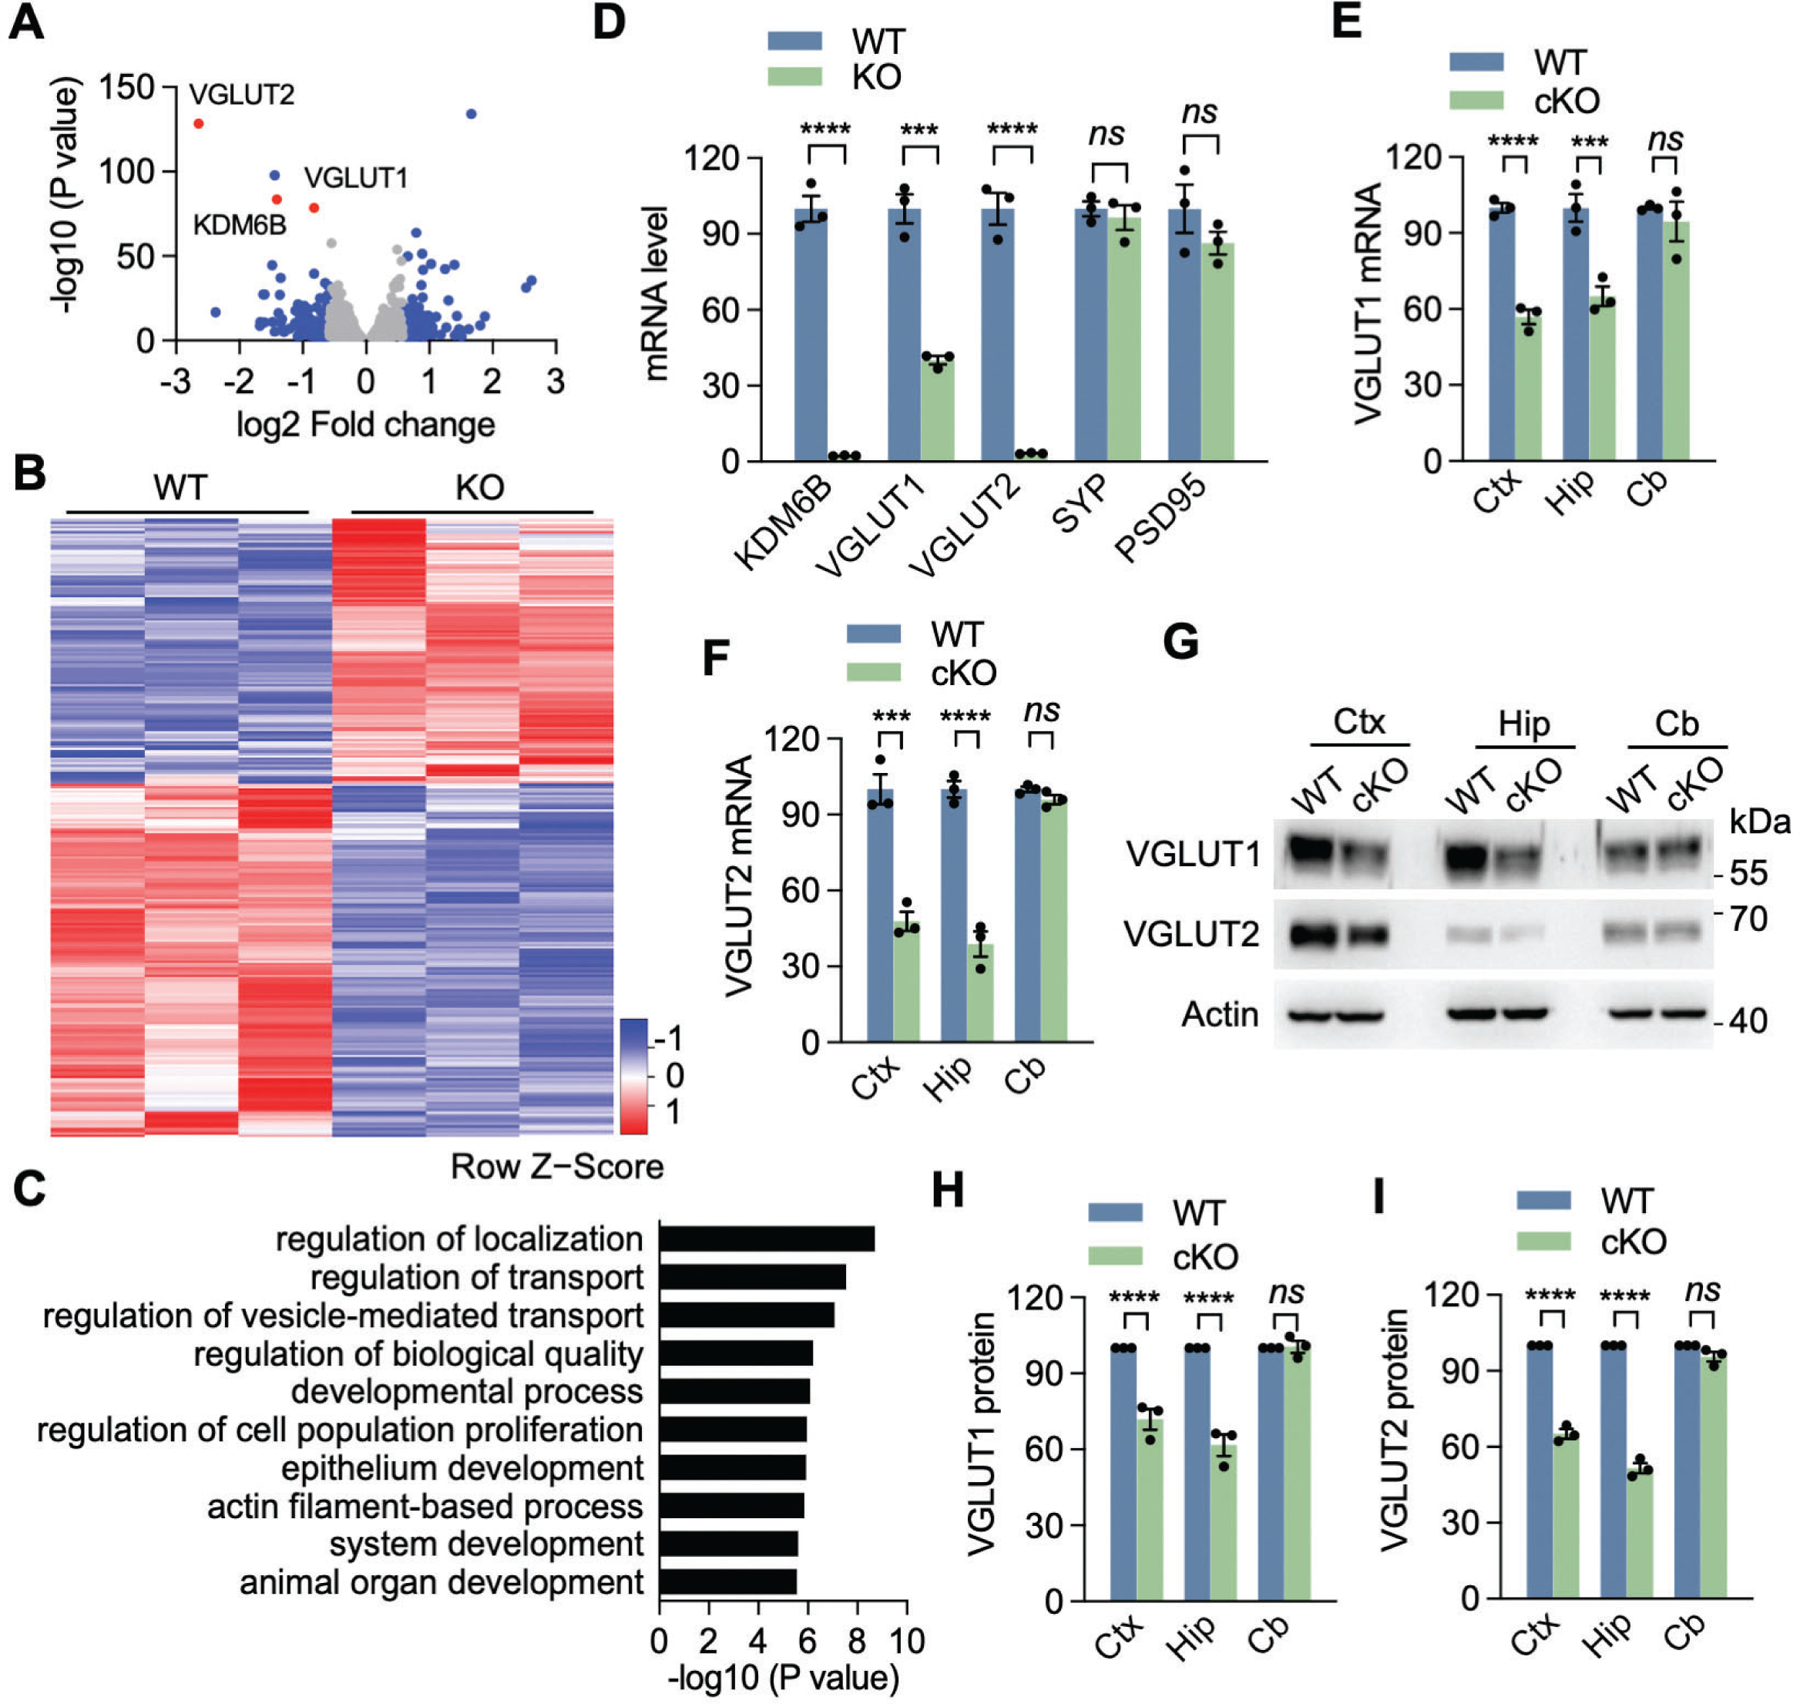
Fig. 3. Identification of VGLUT1 and VGLUT2 as KDM6B main target genes.

(A) Volcano plot showing differentially expressed genes in KDM6B KO neurons compared with WT neurons. Each dot represents a gene. Blue dots are up- or down-regulated genes with more than 1.5-fold change. Three selected genes are denoted and highlighted in red. (B) Heatmap showing expression levels (in z scores) of up- or down-regulated genes with more than 1.5-fold change in KDM6B KO neurons by RNA-seq. n = 3. (C) Gene ontology analysis of downregulated genes in KDM6B KO neurons using PANTHER classification system. The top 10 enriched biological process terms are shown. The full list of enriched biological process terms can be found in Source Data 2. (D) qRT-PCR analysis of KDM6B, VGLUT1, VGLUT2, SYP and PSD95 expression in KDM6B KO and WT neurons. n = 3 biological replicates in each group. Two-tailed Student’s t test. ns, not significant. (E, F) qRT-PCR analysis of VGLUT1 (E) and VGLUT2 (F) expression in KDM6B cKO and WT mice. Ctx, cortex; Hip, hippocampus; Cb, cerebellum. n = 3 mice each group. Two-way ANOVA with Sidak’s multiple comparison test. (G-I) Immunoblot analysis of VGLUT1 and VGLUT2 protein expression in KDM6B cKO and WT mice. The intensity of VGLUT1 (H) and VGLUT2 (I) bands was quantified and normalized to β-actin. n = 3 mice each group. Two-way ANOVA with Sidak’s multiple comparison test. Data were presented as mean ± s.e.m. **p < 0.01. ***p < 0.001; ****p < 0.0001.
