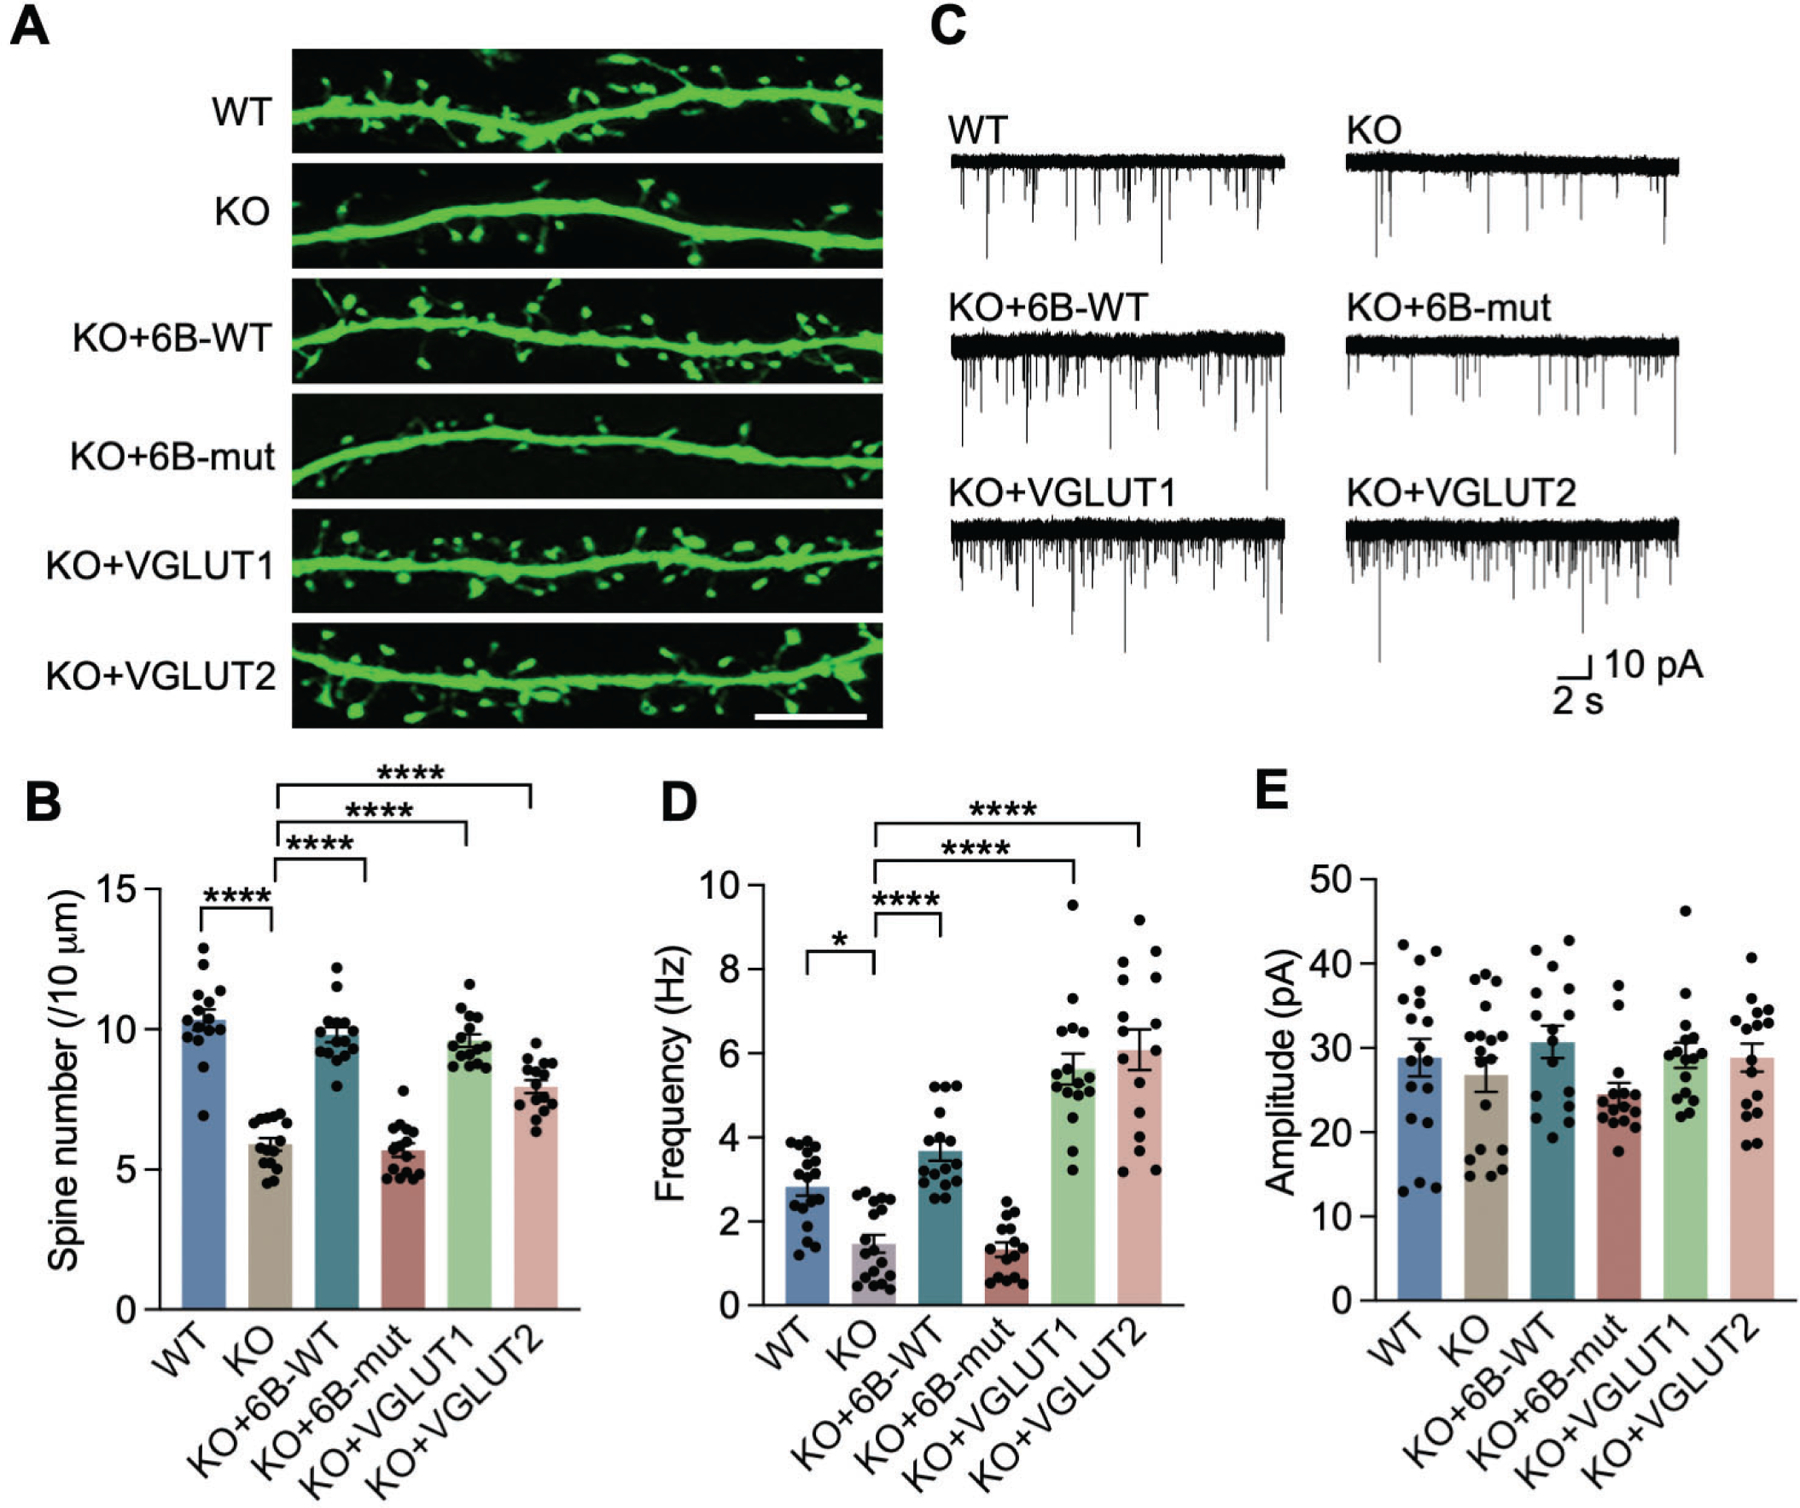
Fig. 5. KDM6B regulates synapse activity through VGLUT1/2 in neurons.

(A, B) Representative images of fragments of dendrites (A) and quantification of spine density (B) in GFP-positive WT and KDM6B KO neurons (DIV 18) expressing KDM6B-C-WT or mut, VGLUT1, or VGLUT2. n = 15 for each group. One-way ANOVA with Tukey’s multiple comparison test. Scale bar, 10 μm. (C) Representative traces of mEPSCs in WT and KDM6B KO neurons expressing KDM6B-C-WT or mut, VGLUT1, or VGLUT2. (D, E) Quantification of mEPSC frequency (D) and amplitude (E). n = 18 cells per group for WT and KO groups; n = 16 cells per group for KO+6B-WT, KO+VGLUT1 and KO+VGLUT2; n = 15 cells for KO+6B-mut group. One-way ANOVA with Tukey’s multiple comparison test. Data were presented as mean ± s.e.m. *p < 0.05; ****p < 0.0001.
