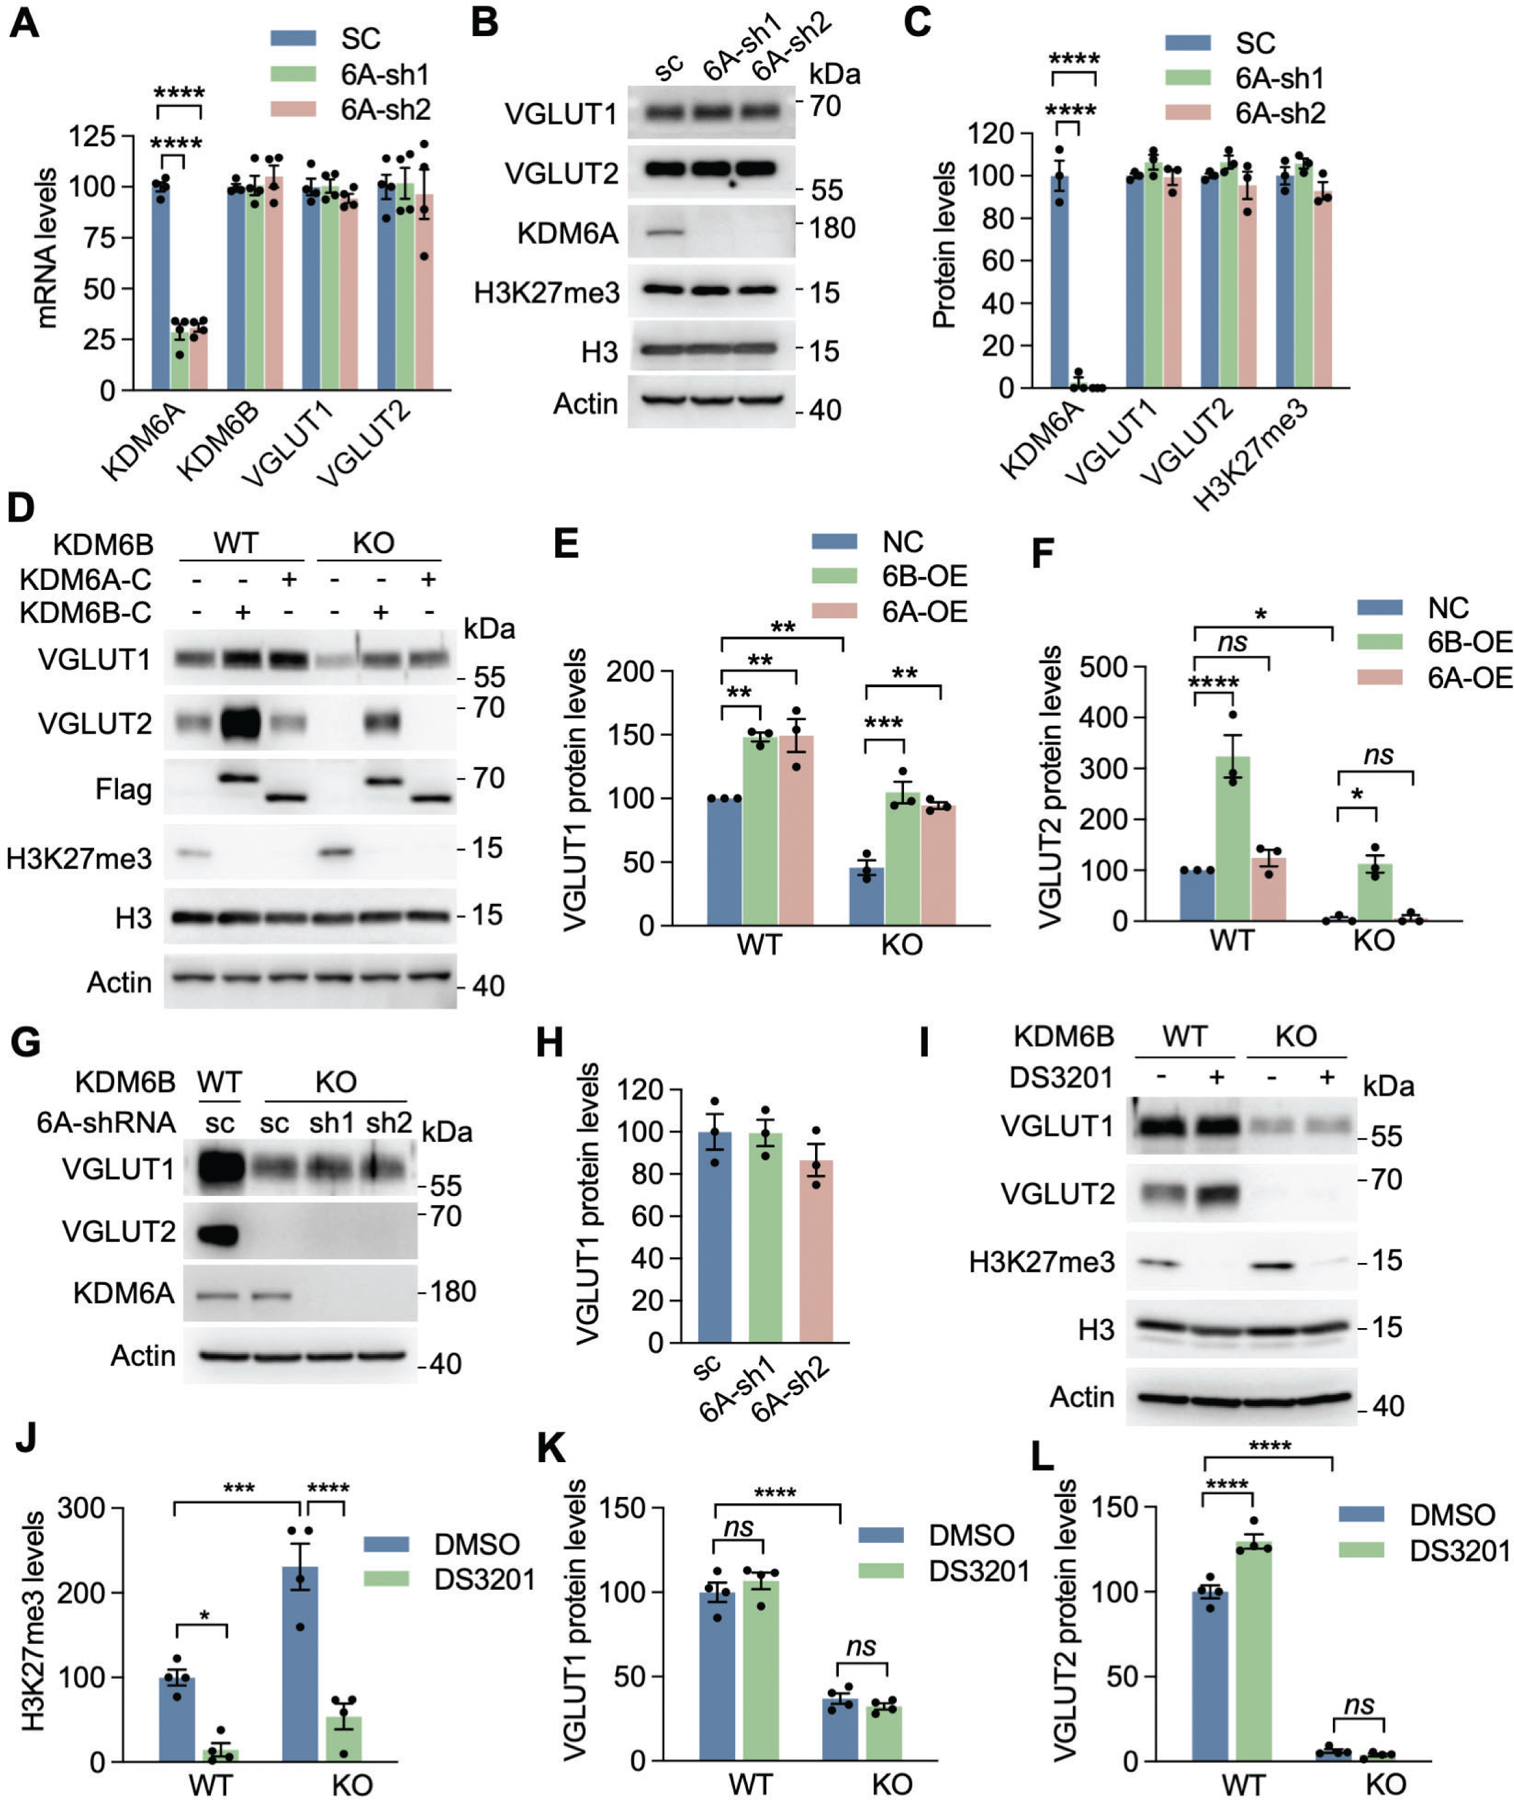
Fig. 6. VGLUT1 and VGLUT2 were mainly regulated by KDM6B, but not KDM6A or EZH1/2.

(A) qRT-PCR analysis of KDM6A, KDM6B, VGLUT1, and VGLUT2 in neurons infected with lentivirus encoding scrambled control (SC) shRNA or KDM6A shRNA1 (sh1) or shRNA2 (sh2). n = 4 biological replicates in each group. One-way ANOVA with Dunnett’s multiple comparison test. (B, C) Immunoblot analysis of KDM6A, H3K27me3, VGLUT1, and VGLUT2 in neurons infected with lentivirus encoding SC shRNA or KDM6A sh1 or sh2 (B). The intensity of KDM6A, H3K27me3, VGLUT1 and VGLUT2 bands was quantified and normalized to β-actin (C). n = 3 biological replicates in each group. One-way ANOVA with Dunnett’s multiple comparison test. (D-F) Immunoblot analysis of KDM6A-C, KDM6B-C, H3K27me3, VGLUT1, and VGLUT2 in WT and KDM6B KO neurons expressing KDM6A-C or KDM6B-C (D). The intensity of VGLUT1 (E) and VGLUT2 (F) bands was quantified and normalized to β-actin. n = 3 biological replicates in each group. One-way ANOVA with Tukey’s multiple comparison test. ns, not significant. (G, H) Immunoblot analysis of KDM6A, VGLUT1, and VGLUT2 in WT and KDM6B KO neurons expressing KDM6A sh1 or sh2 (G). The intensity of VGLUT1 bands was quantified and normalized to β-actin (H). n = 3 biological replicates in each group. One-way ANOVA with Tukey’s multiple comparison test. (I-L) Immunoblot analysis of H3K27me3, VGLUT1, and VGLUT2 in WT and KDM6B KO neurons treated for 7 days with or without a EZH1/2 dual inhibitor DS-3201 (I). The intensity of H3K27me3 (J), VGLUT1 (K), and VGLUT2 (L) bands was quantified and normalized to β-actin. n = 4 biological replicates in each group. One-way ANOVA with Tukey’s multiple comparison test. Data were presented as mean ± s.e.m. *p < 0.05; **p < 0.01; ***p < 0.001; ****p < 0.0001.
