Fig. 2.
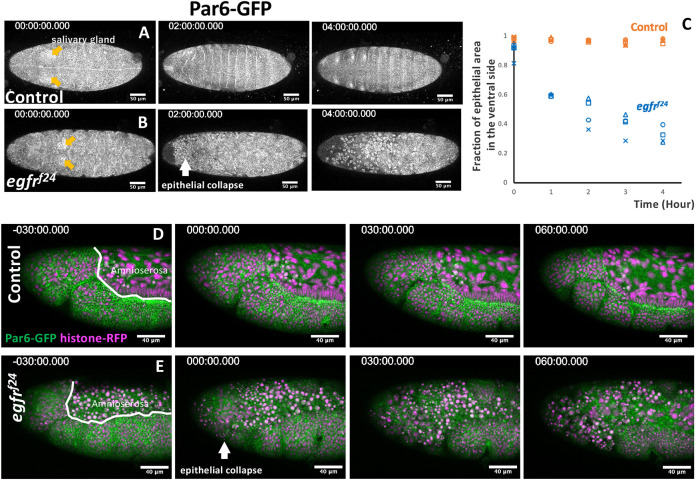
Epithelial collapse in the EGFR mutant embryos. (A,B) Time-lapse imaging of ventral views of control (A) and EGFR-mutant (B) embryos carrying the junction marker Par6-GFP. Time (t)=0 was set at the time of salivary gland invagination (orange arrows). Times are in minutes. The site of the initial epithelial collapse in the EGFR mutant is marked with a white arrow (t=2 h). (C) Time course of the loss of junctional Par6-GFP localization. n=4 for each genotype. (D) Lateral view of the head of a control embryo. (E) An EGFR mutant embryo. Amnioserosa had already disintegrated at t=−30 min, followed by the loss of epithelial integrity at t=0 min. At t=60 min, the entire head region collapsed (n=5).

