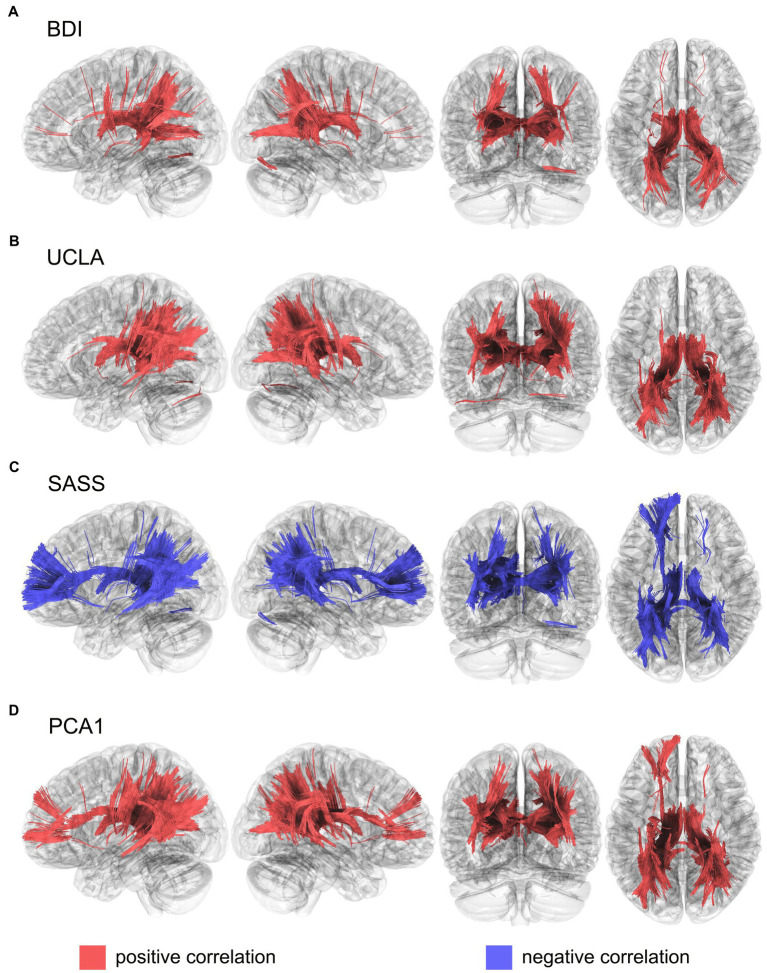
Figure 1.
Structural connectivity correlates of (A). BDI, (B). UCLA, (C). SASS and (D). PCA1, calculated using mean diffusivity index from a diffusion tensor imaging model. Results were corrected with a p < 0.05 FDR. BDI, Beck depression inventory; SASS, social adaptation self-administered scale; UCLA, University of California loneliness scale; PCA1, first component from a principal component analysis that includes BDI, UCLA and SASS.

