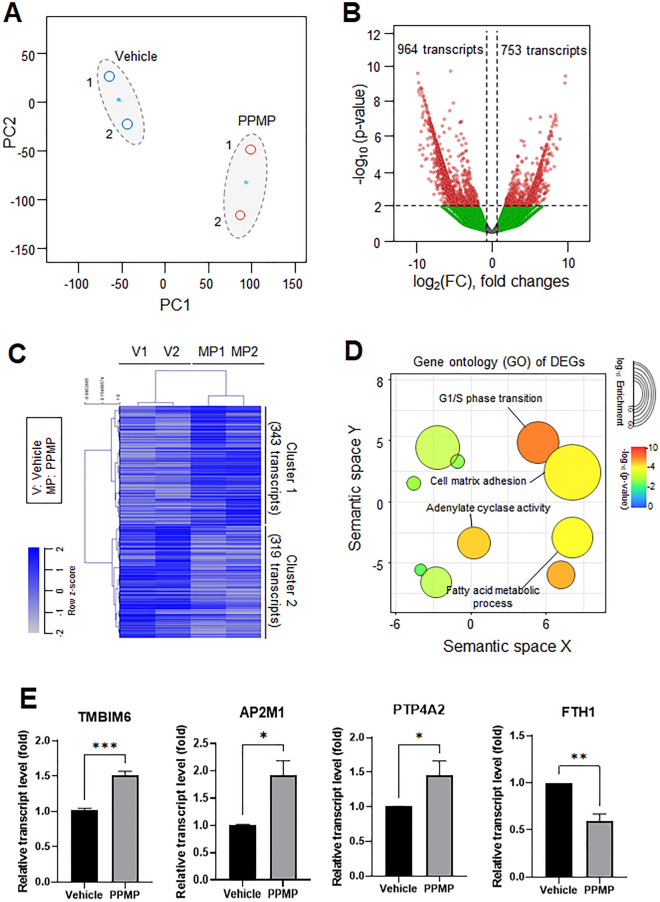
Figure 4.
Transcriptomic dynamics in PPMP-treated MDA-MB-231 cells. The common gene expression patterns through two independent experiments were identified by transcriptomic analysis using the RNA-seq platform. (A) Principal component analysis (PCA) of the RNA-seq analysis. The values indicate the amount of variation attributed to each principal component. The small circles indicate individual samples, blue asterisks indicate the average between experimental replicates, and larger gray ovals represent each experimental group. (B) The volcano plot from the filtered significant DETs from the MDA-MB-231 cells with or without the PPMP incubation. (C) The differential gene expression patterns of DETs in the RNA-seq analysis. The hierarchical clustering of genes (rows) and experimental samples (columns) from the RNA-seq data. (D) The top enriched GO cellular components and biological processes of PPMP-treated cells, visualized from the significantly upregulated DETs from the RNA-seq platform. The size of the circle represents the enriched genes, and the color represents − log10 of the p-value. (E) Transcript levels of TMBIM6, AP2M1, PTP4A2, and FTH1 were evaluated by qRT-PCR in MDA-MB-231 cells (unpaired two-tailed t test, *p < 0.05, **p < 0.01, ***p < 0.001 relative to the vehicle group).

