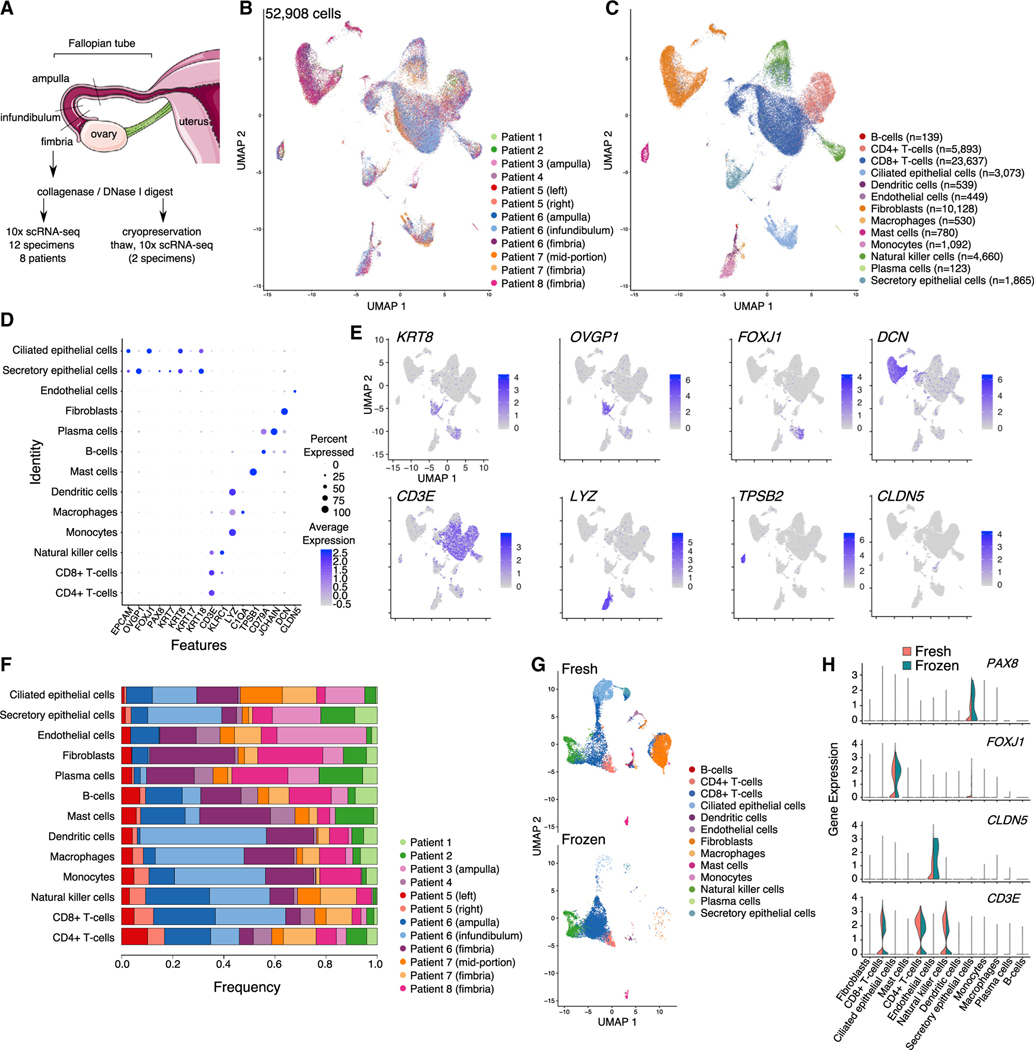
Figure 1. A cellular gene expression atlas of human fallopian tubes in cancer-free women.
(A) Schematic showing overall study design.
(B and C) UMAP plot showing the major cellular clusters (B) by patient and (C) by cell type.
(D) Scaled expression level of cell-type-defining markers and percentage of positive cells in each cluster.
(E) UMAP plots overlaying cluster-specific expression patterns of representative cell-type-defining markers.
(F) Frequency of cells in each cluster, by patient.
(G) UMAP plots for 2 specimens before and after cryopreservation.
(H) Violin plots of representative marker expression in 2 specimens, before and after cryopreservation. UMAP, uniform manifold approximation and projection.

