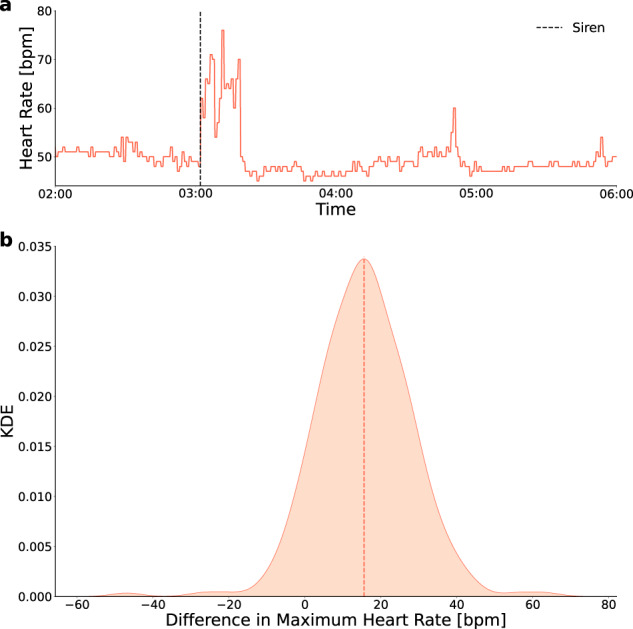
Fig. 1. Changes in heart rate following a siren.

a An example of the change in heart rate for a single participant following a siren. The x-axis represents the time and the y-axis is the heart rate of the participant in beats per minute. Dashed, black, vertical line—the time period in which the siren was heard. b Distribution of the changes in heart rate following a siren compared with the baseline value over all participants. Since each participant could experience several sirens, each participant is represented by the mean of his/her changes. The x-axis represents the mean change in heart rate value and the y-axis is the kernel density estimator (KDE). Dashed, orange, vertical line—median value of the distribution.
