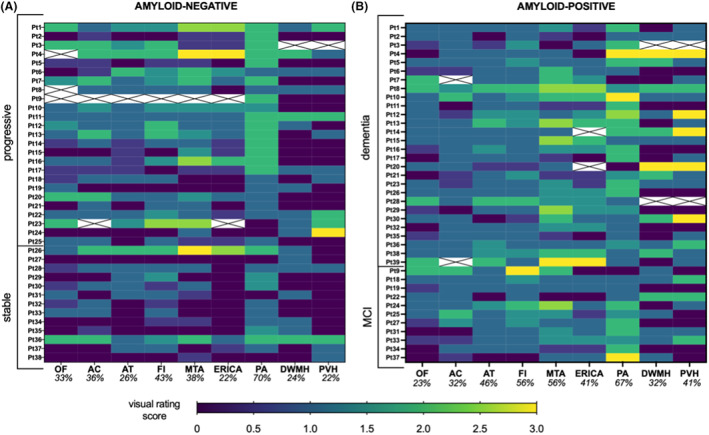
Figure 1.

Heatmaps showing individual‐level visual rating scores in the amyloid‐negative (A) and amyloid‐positive (B) groups. Crossed‐out cells indicate missing visual rating score for that patient due to unavailable MR sequences. Percentages indicate the proportion of abnormal scores in each scale, dichotomized as per Table S3.
