
Figure 4.
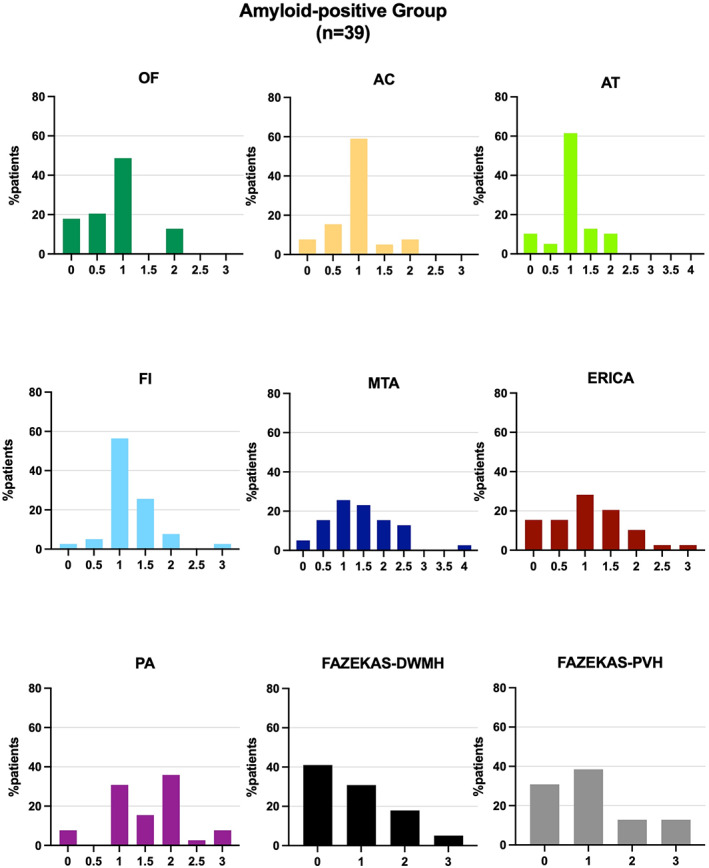
Distribution of visual rating scores for each rating scale. Plotted scores are the result of the average between the left and right hemisphere scores.
Official websites use .gov
A
.gov website belongs to an official
government organization in the United States.
Secure .gov websites use HTTPS
A lock (
) or https:// means you've safely
connected to the .gov website. Share sensitive
information only on official, secure websites.
Distribution of visual rating scores for each rating scale. Plotted scores are the result of the average between the left and right hemisphere scores.