
Figure 2.
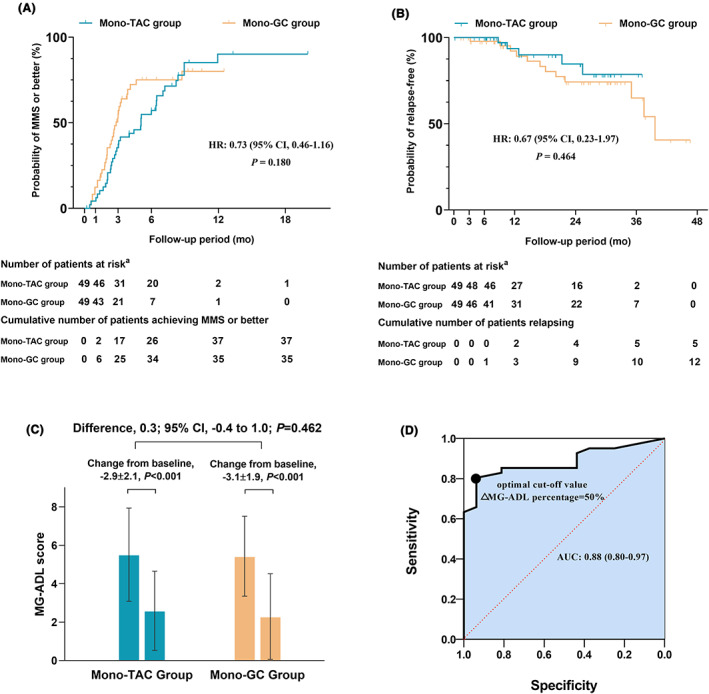
(A) Kaplan–Meier estimates of time to MMS or better in matched mono‐TAC group and mono‐GC group, plotted for subgroups by site of immunotherapy choice. There were 72 events recorded in 98 participants. Patient numbers at each follow‐up period are listed. (B) Kaplan–Meier estimate of relapse in matched mono‐TAC group and mono‐GC group, plotted for subgroups by site of immunotherapy choice. There were 17 events recorded in 98 participants. Patient numbers at each follow‐up period are listed. (C) Change in MG‐ADL scores from baseline to the end of the third month treatment in matched mono‐TAC and mono‐GC groups. Significant changes in MG‐ADL scores from baseline to the end of the third month treatment were observed in matched mono‐TAC and mono‐GC groups. There was no significant between‐group difference in favor of immunotherapy choices for MG‐ADL scores. (D) The receiver‐operating characteristics (ROC) curve represents the area under the curve (AUC) and 95% confidence interval (CI) are 0.88 and 0.80–0.97, respectively. The optimal cut‐off value of ΔMG‐ADL percentage was 50% (sensitivity, 80.5%; specificity, 93.8%).