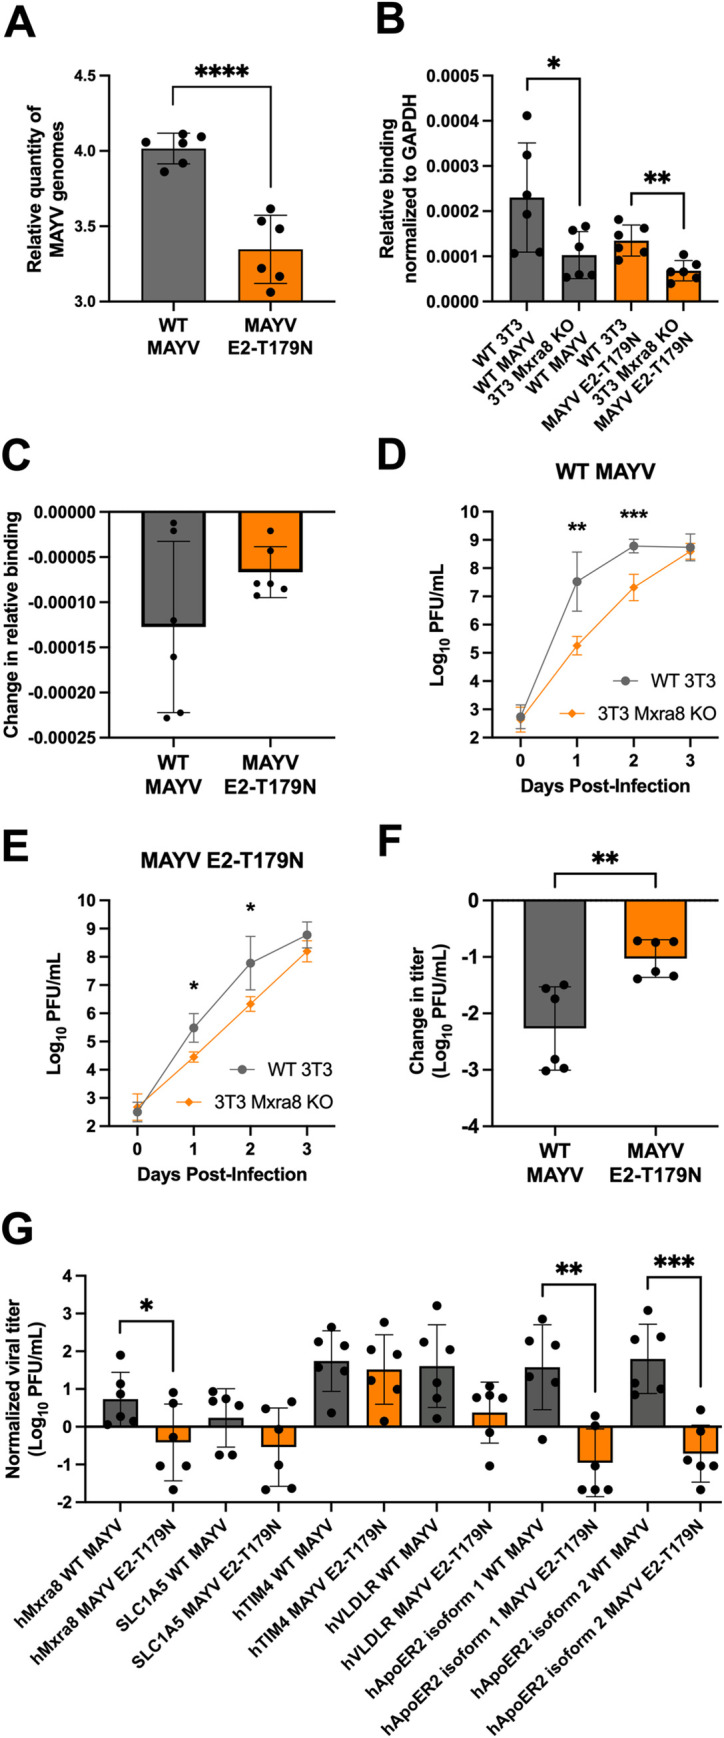
Fig 4. Interaction with human receptors Mxra8 and ApoER2 may contribute to the attenuation of MAYV E2-T179N.

A: Binding of WT MAYV and MAYV E2-T179N to MRC-5 cells. Pre-chilled MRC-5 cells were infected at a MOI of 0.1, and virus was adsorbed to the cells at 4°C. Unbound virus was washed away, and bound virus was quantified by extracting RNA from the cells and performing RT-qPCR. Relative genome copies of bound virus were determined by normalizing the Ct value of bound virus to the Ct value of the housekeeping gene and virus in the inoculum. Statistical Analysis: unpaired t-test; **** = p<0.0001. Data comprise two independent binding assays, each with n = 3. The Y-axis is log-transformed for clearer visualization. B-C: Binding of WT MAYV and MAYV E2-T179N to WT 3T3 and 3T3 Mxra8 KO cells. Binding assays were performed as above for MRC-5 cells. The change in binding between WT 3T3 and 3T3 Mxra8 KO cells was calculated for each virus (C). Statistical Analysis: unpaired t-test; * = p<0.05; ** = p<0.01. D-F: Growth curves of WT MAYV and MAYV E2-T179N in WT 3T3 and 3T3 Mxra8 KO cell lines. WT 3T3 and 3T3 Mxra8 KO cells were infected at a MOI of 0.1 with either WT MAYV (D) or MAYV E2-T179N (E). Viral titers were quantified each day post-infection by plaque assay. Change in titer for each virus between WT 3T3 and 3T3 Mxra8 KO lines were compared (F). Data represent two independent biological replicates performed in triplicate. Statistical Analysis: Two-Way ANOVA with Šídák’s multiple comparisons test and unpaired t-test; * = p<0.05; ** = p<0.01; *** = p<0.001. G: WT MAYV and MAYV E2-T179N infection in HEK-293A cells transiently expressing exogenous, putative MAYV receptors. Cells were transfected with constructs encoding hMxra8, hACE2, SLC1A5, hTIM4, hVLDLR, and hApoER2 isoforms 1 and 2. Twenty-four hours post-transfection, cells were infected with WT MAYV or MAYV E2-T179N at a MOI of 0.1. Infectious virus in the supernatant 24 h.p.i. was quantified by plaque assay and normalized to infection in cells expressing human ACE2. Data comprise two independent replicates, each performed in triplicate. Statistical Analysis: unpaired t-test; * = p<0.05; ** = p<0.01; *** = p<0.001. All error bars represent the standard deviation.
